
Mathematical Statistics with Applications
7th Edition
ISBN: 9780495110811
Author: Dennis Wackerly, William Mendenhall, Richard L. Scheaffer
Publisher: Cengage Learning
expand_more
expand_more
format_list_bulleted
Videos
Textbook Question
Chapter 13.13, Problem 71E
Refer to Exercise 13.42. Answer part (a) by fitting complete and reduced models.
13.42 The accompanying table presents data on yields relating to resistance to stain for three materials (M1, M2, and M3) treated with four chemicals in a randomized block design. (A low value indicates good stain resistance.)
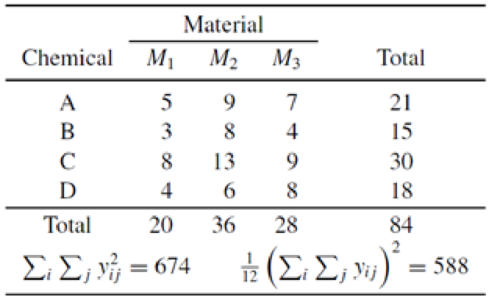
- a Is there evidence of differences in
mean resistance among the four chemicals? Give bounds for the p-value. - b What would you conclude at the α = .05 level of significance?
Expert Solution & Answer

Trending nowThis is a popular solution!

Students have asked these similar questions
[4-5] CONSIDER that the data is UNCORRELATED use alpha .05. Provide the following:
CI of the F value
Statistical Interpretation
a) Determine sum of squares of error (SSE) and correlation coefficient (R?) for the model.
b) Estimate the parameters of reaction model with 95% confidence limits.
c) Evaluate the fit of the model equation you obtained to your data.
d) Estimate concentration of flavor compound after 17 days of storage by using the best model.
Time
Concentration
(d)
(mg/L)
561.00
569.67
3.
252.11
258.40
7.
107.95
7.
113.22
10
47.77
10
50.83
15
23.80
15
22.95
23
9.35
23
10.20
Answer
9.2. SoC Two sociologists administered questionnaires to samples of undergraduates that
measured attitudes toward interpersonal violence (higher scores indicate greater approval of
interpersonal violence). Test the results as reported here for gender, racial, and social-class
differences.
Sample 1
(Males)
Sample 2
(Females)
a.
X1-2.99
X- 2.29
1 = 0.88
82 = 0.91
N = 122
N2 = 251
Sample 1
(Blacks)
Sample 2
(Whites)
b.
X1– 2.76
X2-2.49
10.68
82=0.91
Ni = 43
N2 = 304
Sample 1 (White
Collar)
Sample 2 (Blue
Collar)
C.
X,- 2.46
X- 2.67
41 = 0.91
42 = 0.87
N = 249
N2 = 97
Summarize your results in terms of the significance and the direction of the differences.
Which of these three factors seems to make the biggest difference in attitudes toward
interpersonal violence?
77°F Sunny
Chapter 13 Solutions
Mathematical Statistics with Applications
Ch. 13.2 - The reaction times for two different stimuli in a...Ch. 13.2 - Prob. 2ECh. 13.4 - State the assumptions underlying the ANOVA of a...Ch. 13.4 - Prob. 4ECh. 13.4 - Prob. 5ECh. 13.4 - Suppose that independent samples of sizes n1, n2,,...Ch. 13.4 - Four chemical plants, producing the same products...Ch. 13.4 - Prob. 8ECh. 13.4 - Prob. 9ECh. 13.4 - A clinical psychologist wished to compare three...
Ch. 13.4 - It is believed that women in the postmenopausal...Ch. 13.4 - If vegetables intended for human consumption...Ch. 13.4 - One portion of the research described in a paper...Ch. 13.4 - The Florida Game and Fish Commission desires to...Ch. 13.4 - Prob. 15ECh. 13.4 - An experiment was conducted to examine the effect...Ch. 13.5 - Prob. 17ECh. 13.5 - Refer to Exercise 13.17 and consider YiYi for i ...Ch. 13.5 - Refer to the statistical model for the one-way...Ch. 13.7 - Refer to Examples 13.2 and 13.3. a Use the portion...Ch. 13.7 - Refer to Examples 13.2 and 13.4. a Use the portion...Ch. 13.7 - a Based on your answers to Exercises 13.20 and...Ch. 13.7 - Refer to Exercise 13.7. a Construct a 95%...Ch. 13.7 - Prob. 24ECh. 13.7 - Prob. 25ECh. 13.7 - Prob. 26ECh. 13.7 - Prob. 27ECh. 13.7 - Prob. 28ECh. 13.7 - Prob. 29ECh. 13.7 - Prob. 30ECh. 13.7 - Prob. 31ECh. 13.7 - Prob. 32ECh. 13.7 - Prob. 33ECh. 13.7 - Prob. 34ECh. 13.7 - Prob. 35ECh. 13.8 - Prob. 36ECh. 13.8 - Prob. 37ECh. 13.8 - Prob. 38ECh. 13.8 - Prob. 39ECh. 13.8 - Prob. 40ECh. 13.9 - Prob. 41ECh. 13.9 - The accompanying table presents data on yields...Ch. 13.9 - Refer to Exercise 13.42. Why was a randomized...Ch. 13.9 - Prob. 44ECh. 13.9 - Prob. 45ECh. 13.9 - Prob. 46ECh. 13.9 - Prob. 47ECh. 13.9 - Prob. 48ECh. 13.9 - Prob. 49ECh. 13.9 - Prob. 50ECh. 13.9 - Prob. 51ECh. 13.10 - Prob. 52ECh. 13.10 - Prob. 53ECh. 13.10 - Prob. 54ECh. 13.10 - Refer to Exercise 13.46. Construct a 95%...Ch. 13.10 - Prob. 56ECh. 13.10 - Prob. 57ECh. 13.11 - Prob. 58ECh. 13.11 - Prob. 59ECh. 13.11 - Prob. 60ECh. 13.11 - Prob. 61ECh. 13.11 - Prob. 62ECh. 13.12 - Prob. 63ECh. 13.12 - Prob. 64ECh. 13.12 - Prob. 65ECh. 13.12 - Prob. 66ECh. 13.12 - Prob. 67ECh. 13.12 - Prob. 68ECh. 13.13 - Prob. 69ECh. 13.13 - Prob. 70ECh. 13.13 - Refer to Exercise 13.42. Answer part (a) by...Ch. 13.13 - Refer to Exercise 13.45. Answer part (b) by...Ch. 13 - Prob. 73SECh. 13 - Prob. 74SECh. 13 - Prob. 75SECh. 13 - Prob. 77SECh. 13 - A study was initiated to investigate the effect of...Ch. 13 - Prob. 79SECh. 13 - A dealer has in stock three cars (models A, B, and...Ch. 13 - In the hope of attracting more riders, a city...Ch. 13 - Prob. 84SECh. 13 - Prob. 85SECh. 13 - Prob. 86SECh. 13 - Prob. 87SECh. 13 - Prob. 88SECh. 13 - Prob. 89SECh. 13 - Prob. 90SECh. 13 - Prob. 92SECh. 13 - Prob. 94SE
Knowledge Booster


Learn more about
Need a deep-dive on the concept behind this application? Look no further. Learn more about this topic, statistics and related others by exploring similar questions and additional content below.Similar questions
- For the following table of data. x 1 2 3 4 5 6 7 8 9 10 y 0 0.5 1 2 2.5 3 3 4 4.5 5 a. draw a scatterplot. b. calculate the correlation coefficient. c. calculate the least squares line and graph it on the scatterplot. d. predict the y value when x is 11.arrow_forward17.7 Butterfly wings. Researchers studied the morphological attributes of monarch butterflies (Danaus plexippus), a species that undertakes large seasonal migrations over North America. They measured the forewing weight (in milligrams, mg) of a sample of 92 monarch butterflies, all of which had been reared in captivity in identical conditions.° Figure 17.4 shows the output from the statistical software JMP. (The data are also available in the Large.Butterfly the data file if you wish to practice working with your own software.) Estimate with 95% confidence the mean forewing weight of monarch butterflies reared in captivity. Follow the four- step process as illustrated in Example 17.2. 4 STEP そMP FWweight 30 25 20 15 10 11 12 13 14 15 8 9 10 Summary Statistics Mean 11.795652 Std Dev 1.1759413 Std Err Mean 0.1226004 Upper 95% Mean Lower 95% Mean 1 FIGURE 17.4 Software output (JMP) for the forewing weight of monarch 12.039183 11.552122 92 N. butterflies. Countarrow_forwardLecture(8.8): The amount of time people engage in physical activity mat be related to health outcome. Those who report that they spend more than 15 hours are put into one while those who spend less 10 were put into another group. (Those who fall in between 10 and 15 were left out of the study); The reaearcher then ask the participants to wear a monitor for one month. The average time in minutes is recorded and shown below . Is there any evidence that on average people who watch less than 10 hours watching televsion spend more time on physical activity.?. Test the hypotheses at (alpha=0.05) using the 5 step procedure <10 hours 75 63 118 35 82 >15 hours 62 6 78 43 22 33arrow_forward
- 16.17 In an experiment comparing four diets (treatments), the weight gain y (pounds per day) of pigs was recorded along with two covariates, initial age x₁ (days) and initial weight x2 (pounds). The data are presented in Table 16.11. (a) Using (16.67), (16.68), and (16.69), find Ex, exy, and eyy. Find B. (b) Using (16.77), (16.81), and (16.82), find SSEyr, SST.x, and SS(alu, B). Then test Ho: a₁ = ₂ = a3 = a4, adjusted for the covariates, using the F statistic in (16.83). (c) Test Ho: B = 0 using (16.84). (d) Find B₁, B₂, B3, and 4 using (16.88). Find SSE(F), and SSE(R)y.x using (16.86) and (16.87). Test Ho: B₁ B₂ B3 B4 using (16.89). X1 X2 y X1 78 61 1.40 78 90 59 1.79 99 94 76 1.72 80 71 50 1.47 75 1.26 94 1.28 91 1.34 75 1.55 63 1.57 62 1.26 TABLE 16.11 Initial Age x₁, Initial Weight x2, and Rate of Gain y of 40 Pigs Treatment 1. Treatment 2 Treatment 3 Treatment 4 99 61 80 54 83 57 75 45 62 41 67 40 X2 y X1 74 1.61 78 75 1.31 83 64 1.12 79 48 1.35 70 1.29 85 1.24 83 1.29 1.43 1.29…arrow_forwardThe price X (dollars per pound) and consumption y (in pounds per capita) of beef were samples for 10 randomly selected years. The following data should be used to answer the question that follows. n = 10 Ex = 36.19 Ix² = 134.17 2.9 < x s 6.2 Ey = 774.7 Iy² = 60739.23 Exy = 2832.21 Using this data, a student calculated SSy = 28.43 SSx = 3.2 SSy= 717. Calculate the %3D %3D value of the standard error or regression, Se , and enter you answer accurate to the nearest hundredth (2 decimal places).arrow_forwardQ1 Foot ulcers are common problem for people with diabetes. Higher skin temperatures on the foot indicate an increased risk of ulcers. The article “An Intelligent Insole for Diabetic Patients with the Loss of Protective Sensation" (Kimberly Anderson, M.S. Thesis, Colorado School of Mines), reports measurements of temperatures, in °F, of both feet for 18 diabetic patients. The results are presented in the Table Q1. Table Ql: Measurements of temperatures, in °F of left foot Vs right foot for 18 diabetic patients Left Foot Right Foot Left Foot Right Foot 80 85 75 88 89 87 80 76 81 86 82 78 81 82 85 80 89 85 80 89 87 78 80 87 86 87 82 78 78 86 76 88 89 89 90 88 (a) Compute the least-squares line for predicting the right foot temperature from the left foot temperature. (b) If the left foot temperatures of two patients differ by 2 degrees, predict by how much would their right foot temperatures will differ. (c) Predict the right foot temperature for a patient whose left foot temperature is…arrow_forward
arrow_back_ios
arrow_forward_ios
Recommended textbooks for you
 Calculus For The Life SciencesCalculusISBN:9780321964038Author:GREENWELL, Raymond N., RITCHEY, Nathan P., Lial, Margaret L.Publisher:Pearson Addison Wesley,
 Glencoe Algebra 1, Student Edition, 9780079039897...AlgebraISBN:9780079039897Author:CarterPublisher:McGraw Hill
Calculus For The Life Sciences
Calculus
ISBN:9780321964038
Author:GREENWELL, Raymond N., RITCHEY, Nathan P., Lial, Margaret L.
Publisher:Pearson Addison Wesley,
Glencoe Algebra 1, Student Edition, 9780079039897...
Algebra
ISBN:9780079039897
Author:Carter
Publisher:McGraw Hill
Hypothesis Testing using Confidence Interval Approach; Author: BUM2413 Applied Statistics UMP;https://www.youtube.com/watch?v=Hq1l3e9pLyY;License: Standard YouTube License, CC-BY
Hypothesis Testing - Difference of Two Means - Student's -Distribution & Normal Distribution; Author: The Organic Chemistry Tutor;https://www.youtube.com/watch?v=UcZwyzwWU7o;License: Standard Youtube License