Concept explainers
Videos
Population growth. The two curves below describe the numbers of people in two countries at time t, in years.
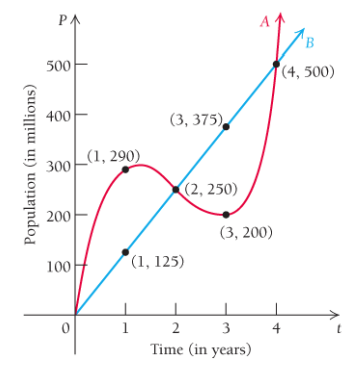
a) Find the average rate of changes of each population with respect to time t as t changes from 0 to 4. This is often called the average growth rate.
b) If the calculations in part (a) were the only ones made, would we detect the fact that the populations were growing differently? Why or why not?
c) Find the average rates of changes of each population as t changes from 0 to 1; from 1 to 2; from 2 to 3; from 3 to 4.
For which population does the statement “the population grew consistently at a rate of 125 million per year” convey accurate information? Why?
Want to see the full answer?
Check out a sample textbook solution
Chapter 1 Solutions
CALCULUS+ITS APPLICATIONS
Additional Math Textbook Solutions
University Calculus: Early Transcendentals (3rd Edition)
Precalculus: Concepts Through Functions, A Unit Circle Approach to Trigonometry (4th Edition)
Glencoe Math Accelerated, Student Edition
Calculus, Single Variable: Early Transcendentals (3rd Edition)
Thomas' Calculus: Early Transcendentals (14th Edition)


- Table 3 gives the annual sales (in millions of dollars) of a product from 1998 to 20006. What was the average rate of change of annual sales (a) between 2001 and 2002, and (b) between 2001 and 2004?arrow_forwardTable 4 gives the population of a town (in thousand) from 2000 to 2008. What was the average rate of change of population (a) between 2002 and 2004, and (b) between 2002 and 2006?arrow_forwardTable 6 shows the year and the number ofpeople unemployed in a particular city for several years. Determine whether the trend appears linear. If so, and assuming the trend continues, in what year will the number of unemployed reach 5 people?arrow_forward
- Population Growth and Decline The table gives the population in a small coastal community for the period 1997-2006. Figures shown arc for January 1 in each year. (a) What was the average rate of change of population between 1998 and 2001? (b) What was the average rate of change of population between 2002 and 2004? (C) For what period of lime was the population increasing? (d) For what period of time was the population decreasing?arrow_forwardImmigration The following graph shows immigrationin thousand to the United States has varied over the past century. Source: Homeland Security. a. Find the average annual rate of change in immigration for the first half of the century from 1905 to 1955. b. Find the average annual rate of change in immigration for the second half of the century from 1955 to 2005. c. Find the average annual rate of change in immigration for the entire century from 1905 to 2005. d. Average your answers to part a and b, and compare the result with your answer from part c. Will these always be equal for any two time periods? e. If the annual average rate of change for entire century continues, predict the number of immigrants in 2009. Compare answer to the actual number of 1,130,818 immigrants.arrow_forwardThe US. import of wine (in hectoliters) for several years is given in Table 5. Determine whether the trend appearslinear. Ifso, and assuming the trend continues, in what year will imports exceed 12,000 hectoliters?arrow_forward
 College AlgebraAlgebraISBN:9781305115545Author:James Stewart, Lothar Redlin, Saleem WatsonPublisher:Cengage Learning
 Calculus For The Life SciencesCalculusISBN:9780321964038Author:GREENWELL, Raymond N., RITCHEY, Nathan P., Lial, Margaret L.Publisher:Pearson Addison Wesley,
 Algebra & Trigonometry with Analytic GeometryAlgebraISBN:9781133382119Author:SwokowskiPublisher:Cengage
 Functions and Change: A Modeling Approach to Coll...AlgebraISBN:9781337111348Author:Bruce Crauder, Benny Evans, Alan NoellPublisher:Cengage Learning