
Introduction To Probability And Statistics
15th Edition
ISBN: 9781337554428
Author: Mendenhall, William.
Publisher: Cengage Learning,
expand_more
expand_more
format_list_bulleted
Concept explainers
Videos
Textbook Question
Chapter 1.3, Problem 4E
Stem and Leaf I Construct a stem and leaf plot for these 50 measurements and answer the questions in Exercises 3−5.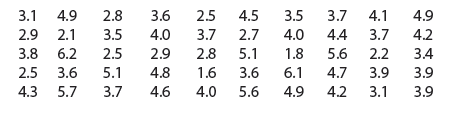
4. Use the stem and leaf plot to find the smallest observation.
Expert Solution & Answer
Want to see the full answer?
Check out a sample textbook solution
Students have asked these similar questions
Find the measurements
How do I find the missing measurements?
Find the measurement of
Chapter 1 Solutions
Introduction To Probability And Statistics
Ch. 1.1 - Experimental UnitsDefine the experimental units...Ch. 1.1 - Experimental UnitsDefine the experimental units...Ch. 1.1 - Experimental UnitsDefine the experimental units...Ch. 1.1 - Experimental UnitsDefine the experimental units...Ch. 1.1 - Experimental UnitsDefine the experimental units...Ch. 1.1 - Qualitative or Quantitative? Are the variables in...Ch. 1.1 - Qualitative or Quantitative? Are the variables in...Ch. 1.1 - Qualitative or Quantitative? Are the variables in...Ch. 1.1 - Qualitative or Quantitative? Are the variables in...Ch. 1.1 - Discrete or Continuous? Are the variables in...
Ch. 1.1 - Discrete or Continuous? Are the variables in...Ch. 1.1 - Discrete or Continuous? Are the variables in...Ch. 1.1 - Discrete or Continuous? Are the variables in...Ch. 1.1 - Discrete or Continuous? Are the variables in...Ch. 1.1 - Discrete or Continuous? Are the variables in...Ch. 1.1 - Discrete or Continuous? Are the variables in...Ch. 1.1 - Discrete or Continuous? Are the variables in...Ch. 1.1 - Discrete or Continuous? Are the variables in...Ch. 1.1 - Populations or Samples? In Exercises 1922,...Ch. 1.1 - Populations or Samples? In Exercises 1922,...Ch. 1.1 - Populations or Samples? In Exercises 1922,...Ch. 1.1 - Populations or Samples? In Exercises 1922,...Ch. 1.1 - Parking on Campus Six vehicles selected from a...Ch. 1.1 - Past U.S. Presidents A data set gives the ages at...Ch. 1.1 - Voter Attitudes You are a candidate for your state...Ch. 1.1 - Cancer Survival Times A researcher wants to...Ch. 1.1 - New Teaching Methods A researcher wants to know...Ch. 1.2 - Pie and Bar Charts The data in Exercises 13...Ch. 1.2 - Pie and Bar Charts The data in Exercises 13...Ch. 1.2 - Pie and Bar Charts The data in Exercises 13...Ch. 1.2 - Groups of People Fifty people are grouped into...Ch. 1.2 - Presidential Popularity After the elections of...Ch. 1.2 - Presidential Popularity After the elections of...Ch. 1.2 - Presidential Popularity After the elections of...Ch. 1.2 - Presidential Popularity After the elections of...Ch. 1.2 - Presidential Popularity After the elections of...Ch. 1.2 - Prob. 10ECh. 1.2 - Prob. 11ECh. 1.2 - Prob. 12ECh. 1.2 - Prob. 13ECh. 1.2 - Prob. 14ECh. 1.2 - Prob. 15ECh. 1.2 - Back to Work How long does it take you to adjust...Ch. 1.2 - Prob. 17ECh. 1.2 - Prob. 18ECh. 1.2 - Prob. 19ECh. 1.2 - Prob. 20ECh. 1.2 - Prob. 21ECh. 1.3 - DotplotsConstruct a dotplot for the data given in...Ch. 1.3 - DotplotsConstruct a dotplot for the data given in...Ch. 1.3 - Stem and Leaf I Construct a stem and leaf plot for...Ch. 1.3 - Stem and Leaf I Construct a stem and leaf plot for...Ch. 1.3 - Stem and Leaf I Construct a stem and leaf plot for...Ch. 1.3 - Stem and Leaf II Use the following set of data...Ch. 1.3 - Stem and Leaf II Use the following set of data...Ch. 1.3 - Prob. 8ECh. 1.3 - Prob. 9ECh. 1.3 - Comparing Graphs A discrete variable can take on...Ch. 1.3 - Prob. 11ECh. 1.3 - Prob. 12ECh. 1.3 - Prob. 13ECh. 1.3 - Prob. 14ECh. 1.3 - Prob. 15ECh. 1.3 - Prob. 16ECh. 1.3 - Prob. 17ECh. 1.3 - Calcium Contents The calcium content (Ca)of a...Ch. 1.3 - Prob. 19ECh. 1.3 - Prob. 20ECh. 1.3 - Prob. 21ECh. 1.3 - Prob. 22ECh. 1.3 - Prob. 23ECh. 1.3 - Prob. 24ECh. 1.3 - American Presidents The following table lists the...Ch. 1.4 - Graphing Relative Frequency Histograms Construct a...Ch. 1.4 - Graphing Relative Frequency Histograms Construct a...Ch. 1.4 - Interpreting Relative Frequency Histograms Use the...Ch. 1.4 - Interpreting Relative Frequency Histograms Use the...Ch. 1.4 - Interpreting Relative Frequency Histograms Use the...Ch. 1.4 - Interpreting Relative Frequency Histograms Use the...Ch. 1.4 - Interpreting Relative Frequency Histograms Use the...Ch. 1.4 - Interpreting Relative Frequency Histograms Use the...Ch. 1.4 - Class Boundaries In Exercises 912, use the...Ch. 1.4 - Class Boundaries In Exercises 912, use the...Ch. 1.4 - Prob. 11ECh. 1.4 - Prob. 12ECh. 1.4 - Prob. 13ECh. 1.4 - Prob. 14ECh. 1.4 - Relative Frequency Histogram I Construct a...Ch. 1.4 - Prob. 16ECh. 1.4 - Prob. 17ECh. 1.4 - Prob. 18ECh. 1.4 - Prob. 19ECh. 1.4 - Prob. 20ECh. 1.4 - Prob. 21ECh. 1.4 - Prob. 22ECh. 1.4 - Prob. 23ECh. 1.4 - Prob. 24ECh. 1.4 - A Recurring Illness The length of time (in months)...Ch. 1.4 - Prob. 26ECh. 1.4 - Prob. 27ECh. 1.4 - Prob. 28ECh. 1.4 - Prob. 29ECh. 1.4 - Prob. 30ECh. 1.4 - Prob. 31ECh. 1.4 - Student Heights The self-reported heights of 105...Ch. 1.4 - Prob. 33ECh. 1 - Quantitative or Qualitative? Identify each...Ch. 1 - Symmetric or Skewed? Do you expect the...Ch. 1 - Continuous or Discrete? Identify each variable as...Ch. 1 - Continuous or Discrete, again Identify each...Ch. 1 - World Lakes A lake is a body of water surrounded...Ch. 1 - Prob. 6RWYLCh. 1 - Election Results The 2016 election was a race in...Ch. 1 - Prob. 8RWYLCh. 1 - Prob. 9RWYLCh. 1 - Pulse Rates A group of 50 biomedical students...Ch. 1 - Prob. 11RWYLCh. 1 - Prob. 12RWYLCh. 1 - Gasoline Tax The following are the 2017 state...Ch. 1 - Prob. 14RWYLCh. 1 - Prob. 15RWYLCh. 1 - Prob. 16RWYLCh. 1 - Kentucky Derby The following data set shows the...Ch. 1 - Prob. 18RWYLCh. 1 - Old Faithful The following data are the waiting...Ch. 1 - Prob. 20RWYLCh. 1 - Prob. 1CSCh. 1 - Prob. 2CS
Knowledge Booster


Learn more about
Need a deep-dive on the concept behind this application? Look no further. Learn more about this topic, statistics and related others by exploring similar questions and additional content below.Similar questions
- Judging from the ruler, estimate the measure of each line segment. a EF b GHarrow_forwardUsing the drawing for Exercise 19, estimate the measure of each angle to the nearest multiple of 5 such as, 20, 25, 30, etc.. a m3 b m4arrow_forwardRead height gage measurement settings in Exercises 24 and 25.arrow_forward
- In a biology class, a group of student brought 9 mic for their experiment. They measured the weight and the length of the body of each mouse from the tail to the nose. The findings are recorded below:Length in cm (x) : 12, 7, 13, 12, 14, 12, 16, 14, 16 Weight in kg (y) : 14, 14, 17, 15, 17, 18, 19, 19, 18 What is the weight of the rat in kg if its length is 7cm? Round your answers to the nearest hundredths.arrow_forwardEstimate the values to complete the table. B C adjacent leg + opposite leg opposite leg hypotenuse angle: hypotenuse adjacent leg 10 0.985 0.174 0.176 20 0.940 0.342 0.364 30 0.866 0.500 0.577 40 0.766 0643 0.839 50 0.643 0.766 1.192 60 0.500 0.866 1.732 70" 0.342 0.940 2,747 80 0.174 0.985 5.671 x Clear + Undo Redo adjacent leg = hypotenuse opposite leg = hypotenuse opposite leg = adjacent leg angle A 0.99 7.12 0.14 Earrow_forwardDetermine the level of measurement of the variable.SLO #1C: time spent playing basketballarrow_forward
- I need help finding the missing measurementarrow_forwarda. Make a list of all possible outcomes. b. What is the probability that the sum of the two dice equal 4? State specifically what outcomes show a sum of two dice equals 4. c. What is the probability that the sum of the two dice is greater than 7? State specifically what outcomes show a sum of two dice greater than 7. d. What is the probability that the sum of the two dice less than 3? State specifically what outcomes show a sum of two dice less than 3. e. What is the probability that the sum of the two dice is divisible by 11? State specifically, if any, what outcomes show a sum of two dice divisible by 11. Part III- Linear Relationship Scenario: A pediatrician wants to determine the relation that may exist between a child's height and head circumference. She randomly selects eleven 3-year old children from her practice, measures their heights and head circumference, and obtains the data shown below: Child's Height and Head Circumference Height (inches) 27.75 24.5 25.5 26 25 25.75 26.5…arrow_forwardUse a stem-and-leaf plot to display the data, which represent the thickness (in centimeters) of ice measured at 20 different locations on a frozen lake. Describe any patterns. 5 Determine the leaves in the stem-and-leaf plot below. Key: 313 3.3 Ice Thickness CO 5.8 6.2 6.9 7.2 5.1 4.9 4.7 5.8 7.0 6.8 8.2 7.5 7.2 5.8 7.2 8.0 7.9 6.9 5.9 4.9 7 ...arrow_forward
arrow_back_ios
arrow_forward_ios
Recommended textbooks for you
 Holt Mcdougal Larson Pre-algebra: Student Edition...AlgebraISBN:9780547587776Author:HOLT MCDOUGALPublisher:HOLT MCDOUGAL
 Elementary Geometry For College Students, 7eGeometryISBN:9781337614085Author:Alexander, Daniel C.; Koeberlein, Geralyn M.Publisher:Cengage,
 Elementary Geometry for College StudentsGeometryISBN:9781285195698Author:Daniel C. Alexander, Geralyn M. KoeberleinPublisher:Cengage Learning
 Mathematics For Machine TechnologyAdvanced MathISBN:9781337798310Author:Peterson, John.Publisher:Cengage Learning,
 Glencoe Algebra 1, Student Edition, 9780079039897...AlgebraISBN:9780079039897Author:CarterPublisher:McGraw Hill
Holt Mcdougal Larson Pre-algebra: Student Edition...
Algebra
ISBN:9780547587776
Author:HOLT MCDOUGAL
Publisher:HOLT MCDOUGAL
Elementary Geometry For College Students, 7e
Geometry
ISBN:9781337614085
Author:Alexander, Daniel C.; Koeberlein, Geralyn M.
Publisher:Cengage,
Elementary Geometry for College Students
Geometry
ISBN:9781285195698
Author:Daniel C. Alexander, Geralyn M. Koeberlein
Publisher:Cengage Learning
Mathematics For Machine Technology
Advanced Math
ISBN:9781337798310
Author:Peterson, John.
Publisher:Cengage Learning,
Glencoe Algebra 1, Student Edition, 9780079039897...
Algebra
ISBN:9780079039897
Author:Carter
Publisher:McGraw Hill
Which is the best chart: Selecting among 14 types of charts Part II; Author: 365 Data Science;https://www.youtube.com/watch?v=qGaIB-bRn-A;License: Standard YouTube License, CC-BY