
Introduction To Probability And Statistics
15th Edition
ISBN: 9781337554428
Author: Mendenhall, William.
Publisher: Cengage Learning,
expand_more
expand_more
format_list_bulleted
Concept explainers
Videos
Textbook Question
Chapter 1.2, Problem 6E
Presidential Popularity After the elections of 2016, a poll was taken to study the approval ratings for past presidents George W. Bush and Barack Obama. The poll, involving 1,009 U.S. adults 18 years or older living in the United States and the District of Columbia, gives approval ratings by gender, race, age, and party ID.1 Use this data for Exercises 6−10.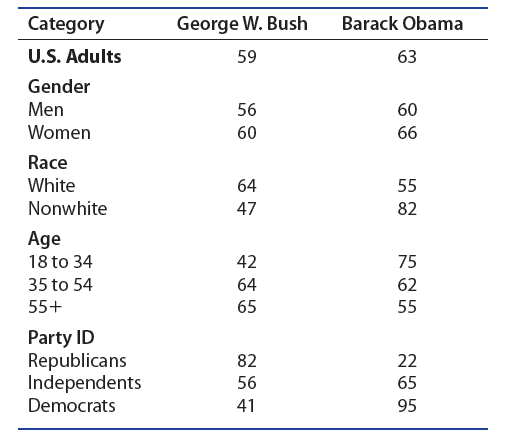
6. Draw a bar chart to describe the approval rating of George W. Bush based on party ID.
Expert Solution & Answer
Want to see the full answer?
Check out a sample textbook solution
Students have asked these similar questions
Customers experiencing technical difficulty with their Internet cable service may call an 800 number for technical support. It takes the technician between 30 seconds and 11 minutes to resolve the problem. The distribution of this support time follows the uniform distribution.
Required:
a. What are the values for a and b in minutes?
Note: Do not round your intermediate calculations. Round your answers to 1 decimal place.
b-1. What is the mean time to resolve the problem?
b-2. What is the standard deviation of the time?
c. What percent of the problems take more than 5 minutes to resolve?
d. Suppose we wish to find the middle 50% of the problem-solving times. What are the end points of these two times?
Exercise 6-6 (Algo) (LO6-3)
The director of admissions at Kinzua University in Nova Scotia estimated the distribution of student admissions for the fall semester on the basis of past experience.
Admissions
Probability
1,100
0.5
1,400
0.4
1,300
0.1
Click here for the Excel Data File
Required:
What is the expected number of admissions for the fall semester?
Compute the variance and the standard deviation of the number of admissions.
Note: Round your standard deviation to 2 decimal places.
1. Find the mean of the x-values (x-bar)
and the mean of the y-values (y-bar) and write/label each here:
2. Label the second row in the table using proper notation; then, complete the table. In the fifth and sixth
columns, show the 'products' of what you're multiplying, as well as the answers.
X
y
x minus x-bar y minus y-bar (x minus x-bar)(y minus y-bar)
(x minus x-bar)^2
xy
16
20
34
4-2
5 2
3. Write the sums that represents Sxx and Sxy in the table, at the bottom of their respective columns.
4. Find the slope of the Regression line: bi
=
(simplify your answer)
5. Find the y-intercept of the Regression line, and then write the equation of the Regression line.
Show your work. Then, BOX your final answer. Express your line as "y-hat equals...
Chapter 1 Solutions
Introduction To Probability And Statistics
Ch. 1.1 - Experimental UnitsDefine the experimental units...Ch. 1.1 - Experimental UnitsDefine the experimental units...Ch. 1.1 - Experimental UnitsDefine the experimental units...Ch. 1.1 - Experimental UnitsDefine the experimental units...Ch. 1.1 - Experimental UnitsDefine the experimental units...Ch. 1.1 - Qualitative or Quantitative? Are the variables in...Ch. 1.1 - Qualitative or Quantitative? Are the variables in...Ch. 1.1 - Qualitative or Quantitative? Are the variables in...Ch. 1.1 - Qualitative or Quantitative? Are the variables in...Ch. 1.1 - Discrete or Continuous? Are the variables in...
Ch. 1.1 - Discrete or Continuous? Are the variables in...Ch. 1.1 - Discrete or Continuous? Are the variables in...Ch. 1.1 - Discrete or Continuous? Are the variables in...Ch. 1.1 - Discrete or Continuous? Are the variables in...Ch. 1.1 - Discrete or Continuous? Are the variables in...Ch. 1.1 - Discrete or Continuous? Are the variables in...Ch. 1.1 - Discrete or Continuous? Are the variables in...Ch. 1.1 - Discrete or Continuous? Are the variables in...Ch. 1.1 - Populations or Samples? In Exercises 1922,...Ch. 1.1 - Populations or Samples? In Exercises 1922,...Ch. 1.1 - Populations or Samples? In Exercises 1922,...Ch. 1.1 - Populations or Samples? In Exercises 1922,...Ch. 1.1 - Parking on Campus Six vehicles selected from a...Ch. 1.1 - Past U.S. Presidents A data set gives the ages at...Ch. 1.1 - Voter Attitudes You are a candidate for your state...Ch. 1.1 - Cancer Survival Times A researcher wants to...Ch. 1.1 - New Teaching Methods A researcher wants to know...Ch. 1.2 - Pie and Bar Charts The data in Exercises 13...Ch. 1.2 - Pie and Bar Charts The data in Exercises 13...Ch. 1.2 - Pie and Bar Charts The data in Exercises 13...Ch. 1.2 - Groups of People Fifty people are grouped into...Ch. 1.2 - Presidential Popularity After the elections of...Ch. 1.2 - Presidential Popularity After the elections of...Ch. 1.2 - Presidential Popularity After the elections of...Ch. 1.2 - Presidential Popularity After the elections of...Ch. 1.2 - Presidential Popularity After the elections of...Ch. 1.2 - Prob. 10ECh. 1.2 - Prob. 11ECh. 1.2 - Prob. 12ECh. 1.2 - Prob. 13ECh. 1.2 - Prob. 14ECh. 1.2 - Prob. 15ECh. 1.2 - Back to Work How long does it take you to adjust...Ch. 1.2 - Prob. 17ECh. 1.2 - Prob. 18ECh. 1.2 - Prob. 19ECh. 1.2 - Prob. 20ECh. 1.2 - Prob. 21ECh. 1.3 - DotplotsConstruct a dotplot for the data given in...Ch. 1.3 - DotplotsConstruct a dotplot for the data given in...Ch. 1.3 - Stem and Leaf I Construct a stem and leaf plot for...Ch. 1.3 - Stem and Leaf I Construct a stem and leaf plot for...Ch. 1.3 - Stem and Leaf I Construct a stem and leaf plot for...Ch. 1.3 - Stem and Leaf II Use the following set of data...Ch. 1.3 - Stem and Leaf II Use the following set of data...Ch. 1.3 - Prob. 8ECh. 1.3 - Prob. 9ECh. 1.3 - Comparing Graphs A discrete variable can take on...Ch. 1.3 - Prob. 11ECh. 1.3 - Prob. 12ECh. 1.3 - Prob. 13ECh. 1.3 - Prob. 14ECh. 1.3 - Prob. 15ECh. 1.3 - Prob. 16ECh. 1.3 - Prob. 17ECh. 1.3 - Calcium Contents The calcium content (Ca)of a...Ch. 1.3 - Prob. 19ECh. 1.3 - Prob. 20ECh. 1.3 - Prob. 21ECh. 1.3 - Prob. 22ECh. 1.3 - Prob. 23ECh. 1.3 - Prob. 24ECh. 1.3 - American Presidents The following table lists the...Ch. 1.4 - Graphing Relative Frequency Histograms Construct a...Ch. 1.4 - Graphing Relative Frequency Histograms Construct a...Ch. 1.4 - Interpreting Relative Frequency Histograms Use the...Ch. 1.4 - Interpreting Relative Frequency Histograms Use the...Ch. 1.4 - Interpreting Relative Frequency Histograms Use the...Ch. 1.4 - Interpreting Relative Frequency Histograms Use the...Ch. 1.4 - Interpreting Relative Frequency Histograms Use the...Ch. 1.4 - Interpreting Relative Frequency Histograms Use the...Ch. 1.4 - Class Boundaries In Exercises 912, use the...Ch. 1.4 - Class Boundaries In Exercises 912, use the...Ch. 1.4 - Prob. 11ECh. 1.4 - Prob. 12ECh. 1.4 - Prob. 13ECh. 1.4 - Prob. 14ECh. 1.4 - Relative Frequency Histogram I Construct a...Ch. 1.4 - Prob. 16ECh. 1.4 - Prob. 17ECh. 1.4 - Prob. 18ECh. 1.4 - Prob. 19ECh. 1.4 - Prob. 20ECh. 1.4 - Prob. 21ECh. 1.4 - Prob. 22ECh. 1.4 - Prob. 23ECh. 1.4 - Prob. 24ECh. 1.4 - A Recurring Illness The length of time (in months)...Ch. 1.4 - Prob. 26ECh. 1.4 - Prob. 27ECh. 1.4 - Prob. 28ECh. 1.4 - Prob. 29ECh. 1.4 - Prob. 30ECh. 1.4 - Prob. 31ECh. 1.4 - Student Heights The self-reported heights of 105...Ch. 1.4 - Prob. 33ECh. 1 - Quantitative or Qualitative? Identify each...Ch. 1 - Symmetric or Skewed? Do you expect the...Ch. 1 - Continuous or Discrete? Identify each variable as...Ch. 1 - Continuous or Discrete, again Identify each...Ch. 1 - World Lakes A lake is a body of water surrounded...Ch. 1 - Prob. 6RWYLCh. 1 - Election Results The 2016 election was a race in...Ch. 1 - Prob. 8RWYLCh. 1 - Prob. 9RWYLCh. 1 - Pulse Rates A group of 50 biomedical students...Ch. 1 - Prob. 11RWYLCh. 1 - Prob. 12RWYLCh. 1 - Gasoline Tax The following are the 2017 state...Ch. 1 - Prob. 14RWYLCh. 1 - Prob. 15RWYLCh. 1 - Prob. 16RWYLCh. 1 - Kentucky Derby The following data set shows the...Ch. 1 - Prob. 18RWYLCh. 1 - Old Faithful The following data are the waiting...Ch. 1 - Prob. 20RWYLCh. 1 - Prob. 1CSCh. 1 - Prob. 2CS
Knowledge Booster


Learn more about
Need a deep-dive on the concept behind this application? Look no further. Learn more about this topic, statistics and related others by exploring similar questions and additional content below.Similar questions
- Apply STATA commands & submit the output for each question only when indicated below i. Generate the log of birthweight and family income of children. Name these new variables Ibwght & Ifaminc. Include the output of this code. ii. Apply the command sum with the detail option to the variable faminc. Note: you should find the 25th percentile value, the 50th percentile and the 75th percentile value of faminc from the output - you will need it to answer the next question Include the output of this code. iii. iv. Use the output from part ii of this question to Generate a variable called "high_faminc" that takes a value 1 if faminc is less than or equal to the 25th percentile, it takes the value 2 if faminc is greater than 25th percentile but less than or equal to the 50th percentile, it takes the value 3 if faminc is greater than 50th percentile but less than or equal to the 75th percentile, it takes the value 4 if faminc is greater than the 75th percentile. Include the outcome of this code…arrow_forwardsolve this on paperarrow_forwardApply STATA commands & submit the output for each question only when indicated below i. Apply the command egen to create a variable called "wyd" which is the rowtotal function on variables bwght & faminc. ii. Apply the list command for the first 10 observations to show that the code in part i worked. Include the outcome of this code iii. Apply the egen command to create a new variable called "bwghtsum" using the sum function on variable bwght by the variable high_faminc (Note: need to apply the bysort' statement) iv. Apply the "by high_faminc" statement to find the V. descriptive statistics of bwght and bwghtsum Include the output of this code. Why is there a difference between the standard deviations of bwght and bwghtsum from part iv of this question?arrow_forward
- According to a health information website, the distribution of adults’ diastolic blood pressure (in millimeters of mercury, mmHg) can be modeled by a normal distribution with mean 70 mmHg and standard deviation 20 mmHg. b. Above what diastolic pressure would classify someone in the highest 1% of blood pressures? Show all calculations used.arrow_forwardWrite STATA codes which will generate the outcomes in the questions & submit the output for each question only when indicated below i. ii. iii. iv. V. Write a code which will allow STATA to go to your favorite folder to access your files. Load the birthweight1.dta dataset from your favorite folder and save it under a different filename to protect data integrity. Call the new dataset babywt.dta (make sure to use the replace option). Verify that it contains 2,998 observations and 8 variables. Include the output of this code. Are there missing observations for variable(s) for the variables called bwght, faminc, cigs? How would you know? (You may use more than one code to show your answer(s)) Include the output of your code (s). Write the definitions of these variables: bwght, faminc, male, white, motheduc,cigs; which of these variables are categorical? [Hint: use the labels of the variables & the browse command] Who is this dataset about? Who can use this dataset to answer what kind of…arrow_forwardApply STATA commands & submit the output for each question only when indicated below İ. ii. iii. iv. V. Apply the command summarize on variables bwght and faminc. What is the average birthweight of babies and family income of the respondents? Include the output of this code. Apply the tab command on the variable called male. How many of the babies and what share of babies are male? Include the output of this code. Find the summary statistics (i.e. use the sum command) of the variables bwght and faminc if the babies are white. Include the output of this code. Find the summary statistics (i.e. use the sum command) of the variables bwght and faminc if the babies are male but not white. Include the output of this code. Using your answers to previous subparts of this question: What is the difference between the average birthweight of a baby who is male and a baby who is male but not white? What can you say anything about the difference in family income of the babies that are male and male…arrow_forward
- A public health researcher is studying the impacts of nudge marketing techniques on shoppers vegetablesarrow_forwardThe director of admissions at Kinzua University in Nova Scotia estimated the distribution of student admissions for the fall semester on the basis of past experience. Admissions Probability 1,100 0.5 1,400 0.4 1,300 0.1 Click here for the Excel Data File Required: What is the expected number of admissions for the fall semester? Compute the variance and the standard deviation of the number of admissions. Note: Round your standard deviation to 2 decimal places.arrow_forwardA pollster randomly selected four of 10 available people. Required: How many different groups of 4 are possible? What is the probability that a person is a member of a group? Note: Round your answer to 3 decimal places.arrow_forward
- Wind Mountain is an archaeological study area located in southwestern New Mexico. Potsherds are broken pieces of prehistoric Native American clay vessels. One type of painted ceramic vessel is called Mimbres classic black-on-white. At three different sites the number of such sherds was counted in local dwelling excavations. Test given. Site I Site II Site III 63 19 60 43 34 21 23 49 51 48 11 15 16 46 26 20 31 Find .arrow_forwardRothamsted Experimental Station (England) has studied wheat production since 1852. Each year many small plots of equal size but different soil/fertilizer conditions are planted with wheat. At the end of the growing season, the yield (in pounds) of the wheat on the plot is measured. Suppose for a random sample of years, one plot gave the following annual wheat production (in pounds): 4.46 4.21 4.40 4.81 2.81 2.90 4.93 3.54 4.16 4.48 3.26 4.74 4.97 4.02 4.91 2.59 Use a calculator to verify that the sample variance for this plot is . Another random sample of years for a second plot gave the following annual wheat production (in pounds): 3.89 3.81 3.95 4.07 4.01 3.73 4.02 3.78 3.72 3.96 3.62 3.76 4.02 3.73 3.94 4.03 Use a calculator to verify that the sample variance for this plot is . Suppose that we test the claim using that the population variance of annual wheat production for the first plot is larger…arrow_forwardIt is thought that prehistoric Native Americans did not take their best tools, pottery, and household items when they visited higher elevations for their summer camps. It is hypothesized that archaeological sites tend to lose their cultural identity and specific cultural affiliation as the elevation of the site increases. Let x be the elevation (in thousands of feet) for an archaeological site in the southwestern United States. Let y be the percentage of unidentified artifacts (no specific cultural affiliation) at a given elevation. Suppose that the following data were obtained for a collection of archaeological sites in New Mexico: x 5.50 6.00 6.75 7.00 7.75 y 37 38 92 70 99 Find the equation of the least squares line . Round a and b to three decimal places.arrow_forward
arrow_back_ios
SEE MORE QUESTIONS
arrow_forward_ios
Recommended textbooks for you
 Big Ideas Math A Bridge To Success Algebra 1: Stu...AlgebraISBN:9781680331141Author:HOUGHTON MIFFLIN HARCOURTPublisher:Houghton Mifflin Harcourt
 Holt Mcdougal Larson Pre-algebra: Student Edition...AlgebraISBN:9780547587776Author:HOLT MCDOUGALPublisher:HOLT MCDOUGAL
 Glencoe Algebra 1, Student Edition, 9780079039897...AlgebraISBN:9780079039897Author:CarterPublisher:McGraw Hill
 Functions and Change: A Modeling Approach to Coll...AlgebraISBN:9781337111348Author:Bruce Crauder, Benny Evans, Alan NoellPublisher:Cengage Learning
 Algebra & Trigonometry with Analytic GeometryAlgebraISBN:9781133382119Author:SwokowskiPublisher:Cengage
Big Ideas Math A Bridge To Success Algebra 1: Stu...
Algebra
ISBN:9781680331141
Author:HOUGHTON MIFFLIN HARCOURT
Publisher:Houghton Mifflin Harcourt
Holt Mcdougal Larson Pre-algebra: Student Edition...
Algebra
ISBN:9780547587776
Author:HOLT MCDOUGAL
Publisher:HOLT MCDOUGAL
Glencoe Algebra 1, Student Edition, 9780079039897...
Algebra
ISBN:9780079039897
Author:Carter
Publisher:McGraw Hill
Functions and Change: A Modeling Approach to Coll...
Algebra
ISBN:9781337111348
Author:Bruce Crauder, Benny Evans, Alan Noell
Publisher:Cengage Learning
Algebra & Trigonometry with Analytic Geometry
Algebra
ISBN:9781133382119
Author:Swokowski
Publisher:Cengage
Statistics 4.1 Point Estimators; Author: Dr. Jack L. Jackson II;https://www.youtube.com/watch?v=2MrI0J8XCEE;License: Standard YouTube License, CC-BY
Statistics 101: Point Estimators; Author: Brandon Foltz;https://www.youtube.com/watch?v=4v41z3HwLaM;License: Standard YouTube License, CC-BY
Central limit theorem; Author: 365 Data Science;https://www.youtube.com/watch?v=b5xQmk9veZ4;License: Standard YouTube License, CC-BY
Point Estimate Definition & Example; Author: Prof. Essa;https://www.youtube.com/watch?v=OTVwtvQmSn0;License: Standard Youtube License
Point Estimation; Author: Vamsidhar Ambatipudi;https://www.youtube.com/watch?v=flqhlM2bZWc;License: Standard Youtube License