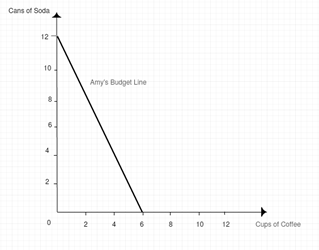
Total income of Amy is $12 a week. The price of coffee is $2 a cup and price of soda is $1 a cup. Create the graph of Amy's budget line. Can Amy consume the combination of 7 cans of soda and 2 cups of coffee a week or 7 cups of coffee and 2 cans of soda a week? Also, determine the relative price of a cup of coffee
Explanation of Solution
The budget line linear equation is:
The x-axis coordinate of budget line is: Income divided by price of Coffee: 6
The y-axis coordinate of budget line is: Income divided by price of Soda: 12
Amy's budget line is given below:

Now, with the different consumption bundles:
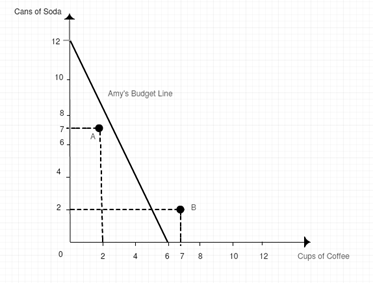
With 7 cans of soda and 2 cups of coffee, the total expenditure would be $11 which is less than total income of $12:
The consumer, Amy can afford this consumption bundle because the expenditure is less than income but some income is still saved. So, Amy can consume more of Soda cans or use it in other combination of consumption bundle so that her total expenditure is equal to total income.
Whereas, with 2 cans of Soda and 7 cups of coffee, the total expenditure would be $16 which is more than total income of $12:
So, Amy cannot afford this consumption bundle because its expenditure is more than her income level.
The first and second consumption bundles are shown in the diagram below as point A and point B, respectively.

The relative price of a cup of coffee is the price of coffee divided by price of a can of soda.
Therefore,
Budget Line: It is a graphical representation of a budget constraint of a consumer. The budget constraint is a linear equation which is the function of price of goods, income of the consumer and quantities consumed by the consumer. It is given below:
For two goods, the equation of budget line is:
Where,
'X' and 'Y' are the quantities of two goods.
Want to see more full solutions like this?
Chapter 13 Solutions
Foundations of Economics (8th Edition)
- The total utility schedule of Sharon is given below for the number of shoes she consumes. i. Calculate Sharon’s marginal utility schedule. ii. Plot a graph of total and marginal utility.iii. What is the maximum number of shoes that Sharon will consume? Explainarrow_forwardHafidh's income is $200 a month. The price of watch is $25 a show, and the price of a Jeans is $15. a) Calculate the equation for Hafidh's budget line b) Draw a graph of Hafidh's budget line with the quantity of Watches on the x-axis. c) If Hafidh's income increased from S200 to 350S. Explain and show how Hafidh's budget line changes with watches on the x-axis.arrow_forwardThe graph shows the budget line for a consumer who only buys cookies and magazines. If the consumer's income is $20, what is the price of a Magazine? 24 20 16 4 2 4 6 8 10 12 Magazines (number per week) dollar(s) Cookies (number per week)arrow_forward
- . Kawther’s income is OMR12 a week. The price of small-sized pizza is OMR3, and the price of a fresh juice is OMR3. Calculate the equation for Kawther’s budget line and illustrate all options on the table. Draw a graph of Kawther’s budget line with the quantity of fresh juice on the x-axis. Kawther’s income is OMR12 a week. The price of small-sized pizza rises from OMR3 to OMR6, and the price of a fresh juice is unchanged at OMR3. Explain how Kawther’s budget line changes with fresh juice on the x-axis.arrow_forwardMarie has a weekly budget of $24. Pie's are $12. Magazine's are $4. What is the maximum number of pies Marie can buy in a week? What is the maximum number of magazines Marie can buy in a week?arrow_forwardGiven that Tebogo's income is P1800, price of food is P30 and price of entertainment is P40. Draw Tebogo's budget linearrow_forward
- Sara is a teenage artist who has been making paintings based on watercolor, each painting sells for 150 bs and she makes them every week. Sara likes hamburgers and Coca Cola, the price of hamburgers is 20 bs and Coca Cola is 3 bs. Sara would like to consume 3 hamburgers and 6 cokes this week. 1. How useful is this consumer basket? 2. Is the 150 Bs enough to satisfy your tastes? If not enough, how much budget do you need? It asks 1. Graph of the indifference curve and the budget line. 2. curve of the new budget line.arrow_forwardWhat does the point on a budget line indicate in terms of prices?arrow_forwardHafidh’s income is $200 a month. The price of watch is $25 a show, and the price of a Jeans is $15. Calculate the equation for Hafidh’s budget line Draw a graph of Hafidh’s budget line with the quantity of Watches on the x-axis. If Hafidh’s income increased from $200 to 350$. Explain and show how Hafidh’s budget line changes with watches on the x-axis.arrow_forward
- The graph shows the budget line for a consumer who only buys cookies and magazines. If the consumer's income is $20, what is the price of a cookie? Cookies (number per week) 24 20 16 8 0 2 4 6 8 10 12 Magazines (number per week)arrow_forwardI need it in words not handwritten and don't copy from other place pleaseee do itttt your own solutionarrow_forwardimpacts of marginal utility. Imagine that you are a seller of phones: How can you increase the consumer demand curve by helping increase the marginal utility for consumers? Detail specific steps to take and provide examples.arrow_forward
 Economics (MindTap Course List)EconomicsISBN:9781337617383Author:Roger A. ArnoldPublisher:Cengage Learning
 Economics Today and Tomorrow, Student EditionEconomicsISBN:9780078747663Author:McGraw-HillPublisher:Glencoe/McGraw-Hill School Pub Co


