
PRIN.OF CORPORATE FINANCE
13th Edition
ISBN: 9781260013900
Author: BREALEY
Publisher: RENT MCG
expand_more
expand_more
format_list_bulleted
Concept explainers
Videos
Textbook Question
Chapter 13, Problem 17PS
Abnormal returns Here are alphas and betas for Estée Lauder and Caterpillar Tractor for the 60 months ending June 2017. Alpha is expressed as a percent per month.
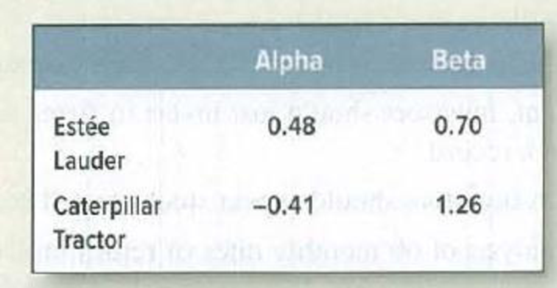
Explain how these estimates would be used to calculate an abnormal return.
Expert Solution & Answer
Want to see the full answer?
Check out a sample textbook solution
Students have asked these similar questions
In 2017 and 2018, Organigram (ticker symbol: OGI) earned returns of 18.18% and −5.34%, respectively. In 2019 and 2020, they earned returns of 20.57% and 8.73%, respectively. Given this information, Organigram’s variance of returns during 2017-2020 was
a. .01658
b. .00631
c. .01842
d. .11753
e. .01381
he following data represents the annual sales of a Digitech Automation products SAOG.
Year
2014
2015
2016
2017
2018
Sales (in Millions)
OMR
380
440
520
396
514
Use method of least squares to calculate the trend values and the forecast for the future period.
Which of the following is the annual sales forecast for the year 2019 using least squares method?
a.
539.6 Million OMR
b.
584.4 Million OMR
c.
606.8 Million OMR
d.
562 Million OMR
Suppose the returns on an asset are normally distributed. The historical average annual return for the asset was 5.7 percent and the standard deviation was 18.3 percent.
a.
What is the probability that your return on this asset will be less than –4.1 percent in a given year? Use the NORMDIST function in Excel® to answer this question. (Do not round intermediate calculations and enter your answer as a percent rounded to 2 decimal places, e.g., 32.16.)
b.
What range of returns would you expect to see 95 percent of the time? (Enter your answers for the range from lowest to highest. A negative answer should be indicated by a minus sign. Do not round intermediate calculations and enter your answers as a percent rounded to 2 decimal places, e.g., 32.16.)
c.
What range of returns would you expect to see 99 percent of the time? (Enter your answers for the range from lowest to highest. A negative answer should be indicated by a minus sign. Do not round intermediate calculations…
Chapter 13 Solutions
PRIN.OF CORPORATE FINANCE
Ch. 13 - Market efficiency True or false? The...Ch. 13 - Prob. 2PSCh. 13 - Market efficiency Which (if any) of these...Ch. 13 - Prob. 4PSCh. 13 - Market efficiency How would you respond to the...Ch. 13 - Market efficiency Respond to the following...Ch. 13 - Prob. 7PSCh. 13 - Prob. 8PSCh. 13 - Market efficiency evidence Which of the following...Ch. 13 - Prob. 10PS
Ch. 13 - Prob. 11PSCh. 13 - Prob. 12PSCh. 13 - Market efficiency implications What does the...Ch. 13 - Prob. 14PSCh. 13 - Prob. 15PSCh. 13 - Abnormal returns Here are alphas and betas for...Ch. 13 - Prob. 18PSCh. 13 - Behavioral finance True or false? a. Most managers...Ch. 13 - Prob. 20PSCh. 13 - Prob. 21PSCh. 13 - Prob. 22PS
Knowledge Booster


Learn more about
Need a deep-dive on the concept behind this application? Look no further. Learn more about this topic, finance and related others by exploring similar questions and additional content below.Similar questions
- For the Hawkins Company, the monthly percentages of all shipments received on time over the past 12 months are 80, 82, 84, 83, 83, 84, 85, 84, 82, 83, 84, and 83. Construct a time series plot. What type of pattern exists in the data? Compare a three-month moving average forecast with an exponential smoothing forecast for α = 0.2. Which provides the better forecasts using MSE as the measure of model accuracy? What is the forecast for next month?arrow_forwardSuppose the returns on an asset are normally distributed. The historical average annual return for the asset was 5.2 percent and the standard deviation was 10.6 percent. a. What is the probability that your return on this asset will be less than -9.7 percent in a given year? Use the NORMDIST function in Excel® to answer this question. Note: Do not round intermediate calculations and enter your answer as a percent rounded to 2 decimal places, e.g., 32.16. b. What range of returns would you expect to see 95 percent of the time? Note: Enter your answers for the range from lowest to highest. A negative answer should be indicated by a minus sign. Do not round intermediate calculations and enter your answers as a percent rounded to 2 decimal places, e.g., 32.16. c. What range of returns would you expect to see 99 percent of the time? Note: Enter your answers for the range from lowest to highest. A negative answer should be indicated by a minus sign. Do not round intermediate calculations and…arrow_forwardConsider the following time series: a. Construct a time series plot. What type of pattern exists in the data? Is there an indication of a seasonal pattern? b. Use a multiple linear regression model with dummy variables as follows to develop an equation to account for seasonal effects in the data: Qtr1 = 1 if quarter 1, 0 otherwise; Qtr2 = 1 if quarter 2, 0 otherwise; Qtr3 = 1 if quarter 3, 0 otherwise. c. Compute the quarterly forecasts for next year.arrow_forward
- es Suppose the returns on an asset are normally distributed. The historical average annual return for the asset was 5.7 percent and the standard deviation was 18.3 percent. a. What is the probability that your return on this asset will be less than -4.1 percent in a given year? Use the NORMDIST function in Excel® to answer this question. (Do not round intermediate calculations and enter your answer as a percent rounded to 2 decimal places, e.g., 32.16.) b. What range of returns would you expect to see 95 percent of the time? (Enter your answers for the range from lowest to highest. A negative answer should be indicated by a minus sign. Do not round intermediate calculations and enter your answers as a percent rounded to 2 decimal places, e.g., 32.16.) c. What range of returns would you expect to see 99 percent of the time? (Enter your answers for the range from lowest to highest. A negative answer should be indicated by a minus sign. Do not round intermediate calculations and enter…arrow_forward3. Covid Co. has the following monthly sales in 2020: Sales (000 units) Month Sales (000 units) Month January 567 July 522 February 231 August 752 March 610 September 645 April 309 October 229 May 736 November 456 June 380 December 700 a. Plot the monthly data. b. Forecast September sales volume using the following: 1) A linear regression 2) A 6-month moving average 3) Exponential smoothing with a smoothing constant equal to 0.20 and assuming a March forecast of 600,000. 4) The naïve approach 5) A weighted average using 0.7 for Dec, 0.2 for November and 0.1 for October. 6) Correlation c. Which method in b) is the MOST appropriate method to be used? Why?arrow_forwardConsider the following time series data: Construct a time series plot. What type of pattern exists in the data? Use a multiple regression model with dummy variables as follows to develop an equation to account for seasonal effects in the data: Qtr1 = 1 if quarter 1, 0 otherwise; Qtr2 = 1 if quarter 2. 0 otherwise; Qtr3 = 1 if quarter 3, 0 otherwise. Compute the quarterly forecasts for next year based on the model you developed in part (b). Use a multiple regression model to develop an equation to account for trend and seasonal effects in the data. Use the dummy variables you developed in part (b) to capture seasonal effects and create a variable t such that t = 1 for quarter 1 in year 1, t = 2 for quarter 2 in year 1, … t = 12 for quarter 4 in year 3. Compute the quarterly forecasts for next year based on the model you developed in part (d). Is the model you developed in part (b) or the model you developed in part (d) more effective? Justify your answer.arrow_forward
- Suppose the returns on an asset are normally distributed. The historical average annual return for the asset was 6.4 percent and the standard deviation was 12.4 percent. A. What range of returns would you expect to see 95 percent of the time? (Enter your answers for the range from lowest to highest. A negative answer should be indicated by a minus sign. Do not round intermediate calculations and enter your answers as a percent rounded to 2 decimal places, e.g., 32.16.) B. What range of returns would you expect to see 99 percent of the time? (Enter your answers for the range from lowest to highest. A negative answer should be indicated by a minus sign. Do not round intermediate calculations and enter your answers as a percent rounded to 2 decimal places, e.g., 32.16.)arrow_forwardSuppose the returns on an asset are normally distributed. The historical average annual return for the asset was 5.2 percent and the standard deviation was 10.6 percent. a. What is the probability that your return on this asset will be less than –9.7 percent in a given year? Use the NORMDIST function in Excel® to answer this question. b. What range of returns would you expect to see 95 percent of the time? c. What range of returns would you expect to see 99 percent of the time?arrow_forwardRefer to the time series data in Problem 1. Using the average of all the historical data as a forecast for the next period, compute the following measures of forecast accuracy: a. Mean absolute error b. Mean squared error c. Mean absolute percentage error d. What is the forecast for week 7? 1. Consider the following time series data: Using the nave method (most recent value) as the forecast for the next week, compute the following measures of forecast accuracy: a. Mean absolute error b. Mean squared error c. Mean absolute percentage error d. What is the forecast for week 7?arrow_forward
- Over a particular period, an asset had an average return of 10.9 percent and a standard deviation of 21.2 percent. What range of returns would you expect to see 68 percent of the time for this asset? (A negative answer should be indicated by a minus sign. Input your answers from lowest to highest to receive credit for your answers. Do not round intermediate calculations and enter your answers as a percent rounded to 2 decimal places, e.g., 32.16.) What about 95 percent of the time? (A negative answer should be indicated by a minus sign. Input your answers from lowest to highest to receive credit for your answers. Do not round intermediate calculations and enter your answers as a percent rounded to 2 decimal places, e.g., 32.16.)arrow_forwardcalculate the standard deviations of the following annual returns 2014 5%2015 9%2016 1%2017 (2%) 2018 7%arrow_forwardOver a particular period, an asset had an average return of 12.1 percent and a standard deviation of 20.5 percent. What range of returns would you expect to see 68 percent of the time for this asset? Note: A negative answer should be Indicated by a minus sign. Input your answers from lowest to highest to receive credit for your answers. Do not round Intermedlate calculations and enter your answers as a percent rounded to 2 decimal places, e.g., 32.16. Expected range of returns 96 to % What about 95 percent of the time? Note: A negative answer should be Indicated by a minus sign. Input your answers from lowest to highest to receive credit for your answers. Do not round Intermediate calculations and enter your answers as a percent rounded to 2 decimal places, e.g., 32.16. Expected range of returns % to %arrow_forward
arrow_back_ios
SEE MORE QUESTIONS
arrow_forward_ios
Recommended textbooks for you
 Essentials of Business Analytics (MindTap Course ...StatisticsISBN:9781305627734Author:Jeffrey D. Camm, James J. Cochran, Michael J. Fry, Jeffrey W. Ohlmann, David R. AndersonPublisher:Cengage Learning
 Intermediate Financial Management (MindTap Course...FinanceISBN:9781337395083Author:Eugene F. Brigham, Phillip R. DavesPublisher:Cengage Learning
Essentials of Business Analytics (MindTap Course ...
Statistics
ISBN:9781305627734
Author:Jeffrey D. Camm, James J. Cochran, Michael J. Fry, Jeffrey W. Ohlmann, David R. Anderson
Publisher:Cengage Learning
Intermediate Financial Management (MindTap Course...
Finance
ISBN:9781337395083
Author:Eugene F. Brigham, Phillip R. Daves
Publisher:Cengage Learning
Responsibility Accounting| Responsibility Centers and Segments| US CMA Part 1| US CMA course; Master Budget and Responsibility Accounting-Intro to Managerial Accounting- Su. 2013-Prof. Gershberg; Author: Mera Skill; Rutgers Accounting Web;https://www.youtube.com/watch?v=SYQ4u1BP24g;License: Standard YouTube License, CC-BY