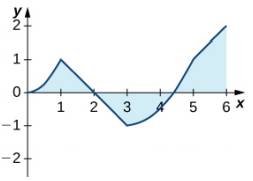
The graph of

a. Over which intervals is
b. Over which intervals is
c. What is the average value of
Trending nowThis is a popular solution!

Chapter 1 Solutions
Calculus Volume 2
Additional Math Textbook Solutions
Elementary Statistics: Picturing the World (7th Edition)
Precalculus
University Calculus: Early Transcendentals (4th Edition)
Calculus: Early Transcendentals (2nd Edition)
Elementary Statistics (13th Edition)
A Problem Solving Approach To Mathematics For Elementary School Teachers (13th Edition)
- Refer to page 313 for a nonlinear differential equation and its linear approximation. Instructions: • Linearize the given nonlinear system around the equilibrium points. • Analyze the stability of each equilibrium using the Jacobian matrix and its eigenvalues. • Discuss the limitations of linearization for determining global behavior. Link: [https://drive.google.com/file/d/1wKSrun-GlxirS3IZ9qoHazb9tC440 AZF/view?usp=sharing]arrow_forwardRefer to page 314 for a matrix and its decomposed form. Instructions: • Verify the given singular value decomposition of the matrix. • • Discuss the geometric interpretation of the left and right singular vectors. Use the SVD to analyze the matrix's rank and nullity. Link: [https://drive.google.com/file/d/1wKSrun-GlxirS3IZ9qoHazb9tC440 AZ F/view?usp=sharing]arrow_forwardRefer to page 312 for a set of mappings between two groups G and H. Instructions: • • Verify which of the provided mappings are homomorphisms. Determine the kernel and image of valid homomorphisms and discuss their properties. • State whether the groups are isomorphic, justifying your conclusion. Link: [https://drive.google.com/file/d/1wKSrun-GlxirS3IZ9qo Hazb9tC440 AZF/view?usp=sharing]arrow_forward
- 12:25 AM Sun Dec 22 uestion 6- Week 8: QuX Assume that a company X + → C ezto.mheducation.com Week 8: Quiz i Saved 6 4 points Help Save & Exit Submit Assume that a company is considering purchasing a machine for $50,000 that will have a five-year useful life and a $5,000 salvage value. The machine will lower operating costs by $17,000 per year. The company's required rate of return is 15%. The net present value of this investment is closest to: Click here to view Exhibit 12B-1 and Exhibit 12B-2, to determine the appropriate discount factor(s) using the tables provided. 00:33:45 Multiple Choice О $6,984. $11,859. $22,919. ○ $9,469, Mc Graw Hill 2 100-arrow_forwardNo chatgpt pls will upvotearrow_forward7. [10 marks] Let G = (V,E) be a 3-connected graph. We prove that for every x, y, z Є V, there is a cycle in G on which x, y, and z all lie. (a) First prove that there are two internally disjoint xy-paths Po and P₁. (b) If z is on either Po or P₁, then combining Po and P₁ produces a cycle on which x, y, and z all lie. So assume that z is not on Po and not on P₁. Now prove that there are three paths Qo, Q1, and Q2 such that: ⚫each Qi starts at z; • each Qi ends at a vertex w; that is on Po or on P₁, where wo, w₁, and w₂ are distinct; the paths Qo, Q1, Q2 are disjoint from each other (except at the start vertex 2) and are disjoint from the paths Po and P₁ (except at the end vertices wo, W1, and w₂). (c) Use paths Po, P₁, Qo, Q1, and Q2 to prove that there is a cycle on which x, y, and z all lie. (To do this, notice that two of the w; must be on the same Pj.)arrow_forward
- 6. [10 marks] Let T be a tree with n ≥ 2 vertices and leaves. Let BL(T) denote the block graph of T. (a) How many vertices does BL(T) have? (b) How many edges does BL(T) have? Prove that your answers are correct.arrow_forward4. [10 marks] Find both a matching of maximum size and a vertex cover of minimum size in the following bipartite graph. Prove that your answer is correct. ย ພarrow_forward5. [10 marks] Let G = (V,E) be a graph, and let X C V be a set of vertices. Prove that if |S||N(S)\X for every SCX, then G contains a matching M that matches every vertex of X (i.e., such that every x X is an end of an edge in M).arrow_forward
- Q/show that 2" +4 has a removable discontinuity at Z=2i Z(≥2-21)arrow_forwardRefer to page 100 for problems on graph theory and linear algebra. Instructions: • Analyze the adjacency matrix of a given graph to find its eigenvalues and eigenvectors. • Interpret the eigenvalues in the context of graph properties like connectivity or clustering. Discuss applications of spectral graph theory in network analysis. Link: [https://drive.google.com/file/d/1wKSrun-GlxirS3IZ9qoHazb9tC440 AZF/view?usp=sharing]arrow_forwardRefer to page 110 for problems on optimization. Instructions: Given a loss function, analyze its critical points to identify minima and maxima. • Discuss the role of gradient descent in finding the optimal solution. . Compare convex and non-convex functions and their implications for optimization. Link: [https://drive.google.com/file/d/1wKSrun-GlxirS31Z9qo Hazb9tC440 AZF/view?usp=sharing]arrow_forward

 Algebra and Trigonometry (MindTap Course List)AlgebraISBN:9781305071742Author:James Stewart, Lothar Redlin, Saleem WatsonPublisher:Cengage Learning
 College AlgebraAlgebraISBN:9781305115545Author:James Stewart, Lothar Redlin, Saleem WatsonPublisher:Cengage Learning
- Algebra & Trigonometry with Analytic GeometryAlgebraISBN:9781133382119Author:SwokowskiPublisher:Cengage
 Big Ideas Math A Bridge To Success Algebra 1: Stu...AlgebraISBN:9781680331141Author:HOUGHTON MIFFLIN HARCOURTPublisher:Houghton Mifflin Harcourt
 Glencoe Algebra 1, Student Edition, 9780079039897...AlgebraISBN:9780079039897Author:CarterPublisher:McGraw Hill


