
EBK STATISTICS FOR BUSINESS AND ECONOMI
13th Edition
ISBN: 8220103633567
Author: Sincich
Publisher: PEARSON
expand_more
expand_more
format_list_bulleted
Videos
Textbook Question
Chapter 13, Problem 13.87ACI
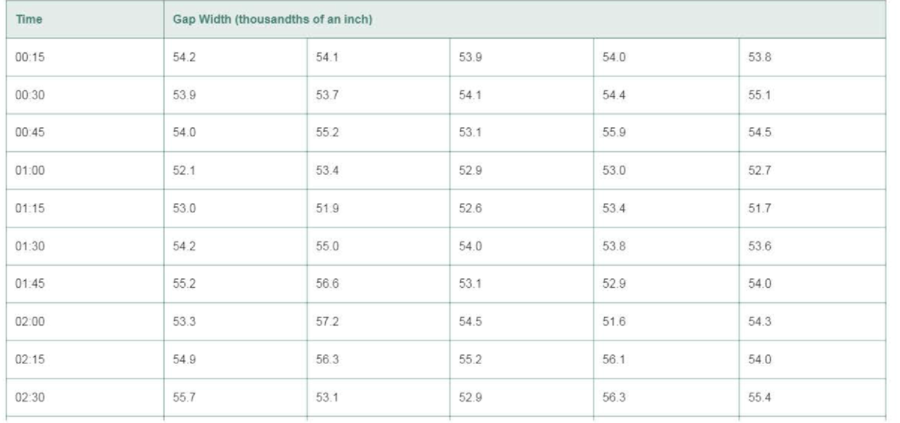
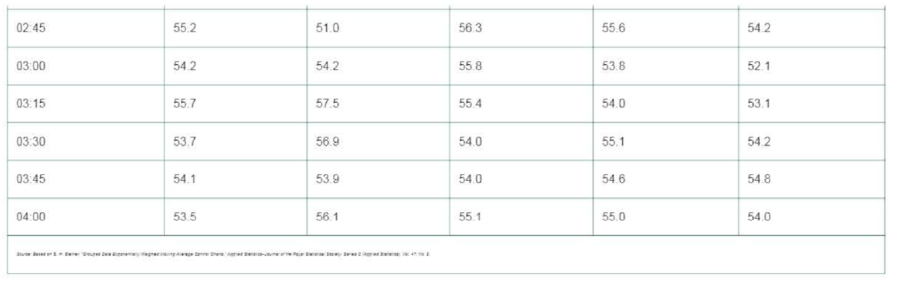
Robotics clamp gap width. Control chart methodology was applied to the manufacturing of a horseshoe-shaped metal fastener called a robotics clamp (Applied Statistics, Vol. 47, 1998). Users of the clamp were concerned with the width of the gap between the two ends of the fastener. Their preferred target width was .054 inch. An optical measuring device was used to measure the gap width of the fastener during the manufacturing process. The manufacturer sampled five finished clamps every 15 minutes throughout its 16-hour daily production schedule and optically measured the gap. Data for 4 consecutive hours of production are presented in the accompanying table.
- a. Construct an R-chart from these data.
- b. Construct an
- c. Apply the pattern-analysis rules to the control charts. Does your analysis suggest that special causes of variation are present in the clamp manufacturing process? Which of the six rules led you to your conclusion?
- d. Should the control limits be used to monitor future process output? Explain.
Expert Solution & Answer
Want to see the full answer?
Check out a sample textbook solution
Students have asked these similar questions
In sample 400 parts
manufactured by a
factory, the number of
defective parts was
found to be 30. The
company, however,
claimed that almost 5%
of their product is
defective. Is the claim
tenable?
The birthweight (in kg) of 55 babies are tabulated in the frequency distribution below:
Birthweight
(kg)
Class Midpoint
Frequency
M
(1– 1.5|
(1.5-2
1.25
6.
1.75
10
(2- 2.5)
2.25
1
(2.5-3)
2.75
15
10
(3-3.5]
3.25
3.
(3.5- 4)
3.75
55
Total
Calculate the relative frequency of the class interval (2 - 2.5).
A quality engineer in charge of a coffee filter pack production line was concerned about
the weight (in grams) of the filter packs being produced. The quality team sampled three
packs every hour, throughout the production day. The table below shows the results:
Sample
number
1
2
3
4
5
6
7
20.6
20.1
20.6
21.5
21.4
21.1
21.4
Weight (g)
21.1
20.0
21.2
22.2
21.1
22.3
20.9
20.7
20.3
21.3
21.4
19.9
19.9
21.1
Chapter 13 Solutions
EBK STATISTICS FOR BUSINESS AND ECONOMI
Ch. 13.4 - What is a control chart? Describe its use.Ch. 13.4 - Explain why rational subgrouping should be used in...Ch. 13.4 - When a control chart is first constructed, why are...Ch. 13.4 - Which process parameter is an x -chart used to...Ch. 13.4 - Even if all the points on an x -chart fall between...Ch. 13.4 - What must be true about the variation of a process...Ch. 13.4 - Use the six pattern-analysis rules described in...Ch. 13.4 - Consider the x -chart shown below. a. Is the...Ch. 13.4 - Use Table IX on page 13-74 to find the value of A2...Ch. 13.4 - Twenty-five consecutive samples of size n = 5 were...
Ch. 13.4 - The data in the following table were collected for...Ch. 13.4 - Prob. 13.12ACBCh. 13.4 - Active pharmaceutical ingredient. During the...Ch. 13.4 - Detecting gender-related employment disparities....Ch. 13.4 - Pain levels of ICU patients. Various interventions...Ch. 13.4 - Quality control for irrigation data. Most farmers...Ch. 13.4 - Improving public health waiting times. Statistical...Ch. 13.4 - Cereal box manufacturing. A machine at K-Company...Ch. 13.4 - Detecting under-reported emissions. The...Ch. 13.4 - 13 20 Selecting the best wafer-slicing machine....Ch. 13.4 - Chunky data. BPI Consulting, a leading provider of...Ch. 13.4 - Military aircraft bolts. A precision parts...Ch. 13.5 - What characteristic of a process is an R-chart...Ch. 13.5 - Prob. 13.24LMCh. 13.5 - Use Table IX on page 13-74 to find the values of...Ch. 13.5 - Construct and interpret an R-chart for the data in...Ch. 13.5 - Construct and interpret an R-chart for the data in...Ch. 13.5 - Construct and interpret an R-chart and an x -chart...Ch. 13.5 - Weight of packed frozen scallops. In Quality...Ch. 13.5 - Detecting gender-related employment disparities....Ch. 13.5 - Pain levels of ICU patients. Refer to the Research...Ch. 13.5 - Quality control for irrigation data. Refer to...Ch. 13.5 - Lowering the thickness of an expensive blow-molded...Ch. 13.5 - Cola bottle filling process. A soft-drink bottling...Ch. 13.5 - Chunky data. Refer to Exercise 13.21e (p. 13-40)...Ch. 13.5 - Replacement times for lost ATM cards. In an effort...Ch. 13.5 - Military aircraft bolts. Refer to the...Ch. 13.5 - Precision of scale weight measurements. The...Ch. 13.6 - What characteristic of a process is a p-chart...Ch. 13.6 - In each of the following cases, use the sample...Ch. 13.6 - The proportion of defective items generated by a...Ch. 13.6 - To construct a p-chart for a manufacturing...Ch. 13.6 - To construct a p-chart, 20 samples of size 150...Ch. 13.6 - Academic failure rates in Nigeria. The quality...Ch. 13.6 - Monitoring surgery complications. An article on...Ch. 13.6 - Rental car call center study. A worldwide rental...Ch. 13.6 - Defective micron chips. A manufacturer produces...Ch. 13.6 - Hand break cable defects. In Control Engineering...Ch. 13.6 - Monitoring newspaper typesetters. Accurate...Ch. 13.6 - Quality of rewritable CDs. A Japanese compact disc...Ch. 13.6 - Leaky process pumps. Quality (February 2008)...Ch. 13.6 - Rubber company lire tests. Goodstone Tire Rubber...Ch. 13.7 - Explain why it is inappropriate to conduct a...Ch. 13.7 - Explain the difference between process spread and...Ch. 13.7 - Describe two different ways to assess the...Ch. 13.7 - Why is it recommended to use and interpret Cp in...Ch. 13.7 - For a process that is in control and follows a...Ch. 13.7 - Find the specification spread for each of the...Ch. 13.7 - Find (or estimate) the process spread for each of...Ch. 13.7 - Find the value of Cp for each of the following...Ch. 13.7 - Upper specification limit of a process. An...Ch. 13.7 - Capability of an in-control process. A process is...Ch. 13.7 - Water use at a thermal power plant. Thermal power...Ch. 13.7 - Cereal box filling process. Refer to the data on...Ch. 13.7 - Military aircraft bolts. Refer to Exercise 13.22...Ch. 13.7 - Bioreactor production of antibodies. Benchtop...Ch. 13.7 - Driver gear bore holes. During the manufacture of...Ch. 13.7 - Lowering the thickness of an expensive blow-molded...Ch. 13 - Define quality and list its important dimensions.Ch. 13 - What is a process? Give an example of an...Ch. 13 - What is a system? Give an example of a system with...Ch. 13 - Describe the six major sources of process...Ch. 13 - Suppose all the output of a process over the last...Ch. 13 - Processes that are in control are predictable;...Ch. 13 - Compare and contrast special and common causes...Ch. 13 - Explain the difference between control limits and...Ch. 13 - Should control charts be used to monitor a process...Ch. 13 - Under what circumstances is it appropriate to use...Ch. 13 - A process is under control and follows a normal...Ch. 13 - Weight of a product. Consider the time series data...Ch. 13 - Lengths of pencils. The length measurements of 20...Ch. 13 - Applying pattern-analysis rules. Use the...Ch. 13 - Defective plastic mold. A company that...Ch. 13 - Robotics clamp gap width. Control chart...Ch. 13 - Package sorting time. AirExpress. an overnight...Ch. 13 - Waiting times of airline passengers. Officials at...Ch. 13 - Defects in graphite shafts. Over the last year, a...Ch. 13 - New iron-making process. Mining Engineering...Ch. 13 - CPU of a computer chip. The central processing...Ch. 13 - Bayfield Mud Company case. The text Quantitative...
Knowledge Booster


Learn more about
Need a deep-dive on the concept behind this application? Look no further. Learn more about this topic, economics and related others by exploring similar questions and additional content below.Similar questions
- Rainbow Harbor Cruises charges $16/adult and $8/child for a round-trip ticket. The records show that, on a certain weekend, 900 took the cruise on Saturday and 1000 took the cruise on Sunday. The total receipts for Saturday were $12,800, and the total receipts for Sunday were $12,000. Determine how many adults and children took the cruise on Saturday and on Sunday. Saturday adults children Sunday adults childrenarrow_forwardWhy can we not use first differences when we have independent cross sections in two years (as opposed to panel data)?arrow_forwardA traditional performance rating benchmark (or guideline) for “normal” effort, or speed, is dealing 52 cardsinto four piles, forming a square with each pile one footapart, in 0.50 minute. Conduct an experiment with one ormore fellow students in which one deals the cards andthe others rate the dealer’s performance, and then compare these subjective ratings with the actual time of thedealer.arrow_forward
- a) For each, find the expressions for marginal utilities and the marginal rate of substitution, and determine whether monotonicity and convexity are met.arrow_forwardManufacturers of tires report that car tires should be able to last an average of 50,000 miles. A new tire company produces a different type of tread and tests 100 randomly selected tires. This sample of 100 tires lasted an average of 51,500 miles. Assuming the new type of tread does not improve the mileage of the tire, 200 sample means were simulated and displayed on the dotplot. Simulated Tire Mileage +++ +++H 47,000 48,000 49,000 50,000 51,000 52,000 53,000 Mean mileage Using the dotplot and the sample mean mileage, is there convincing evidence that the new type of tread improves the mileage of the tire? Yes, because a mean mileage of 51,500 or more occurred only 14 out of 200 times, the mean mileage is statistically significant. There is convincing evidence the new type of tire tread improves mileage of the tire. Yes, because a mean mileage of 51,500 or less occurred 186 out of 200 times, the mean mileage is statistically significant. There is convincing evidence the new type of…arrow_forwardPlease do not provide answer in image formate thank you.arrow_forward
- This question was rejected because the screenshot was not clear. I took two screenshots of the same homework question. Please let me know if it is still unclear.arrow_forwardOA large city hospital conducted a study to investigate the relationship between the number of unauthorized days that employees are absent per year and the distance (miles) between home and work for the employees. A sample of 10 employees was selected and the following data were collected. D Excel file: data14-13.xlsx Distance to Work Number of Days (miles) Absent 8. 8. 9. 8 6. 10 12 14 14 4 18 If required, enter negative values as negative numbers. a. Select the correct scatter diagram for these data. A. Number of Days Absent 10+ 8+ . 6- 2+ 8. 10 12 14 16 18 20 Distance to Work (miles) 4.arrow_forwardFocusing on government spending as a percentage of GDP in the U.S., we observed that between 1820 and 1929 the: minimum value was 3.13%; mean value was 6.83%; and maximum value was 29.03%. In contrast, between 1930 and 2021 , the a) None of the above answers are correct. B) maximum value was 10.94%.c) minimum value was 2.12%. D) mean value was 30.56%. Note:- Do not provide handwritten solution. Maintain accuracy and quality in your answer. Take care of plagiarism. Answer completely. You will get up vote for sure.arrow_forward
- An economist collects data regarding the number of jobs an individual has held by age 21. Tim states he had 4 jobs, Sam had 3, Jill had 3, Sally had 2, and Watney had 10.An economist should use the to draw conclusions. A typical individual had jobs by the age 21.arrow_forwardA merchant who sells newspapers and magazines at the corner kiosk heard you manage the Times’ inventory and asks for your advice. She has a small, variable number of customers who daily purchase the Chicago Sun Times. In order to get the newspapers in time, she has to place an order for the next day’s newspapers before noon. She pays $0.50 for each newspaper and sells them for $1.50 each. She has kept detailed records of her past sales of the Chicago Sun Times and estimates that 10% of the time she sells 10 newspapers, 40% of the time she sells 11, 30% of the time she sells 12, and 20% of the time she sells 13. (a) What is the merchant’s marginal profit and marginal loss? (b) Determine how many Chicago Sun Times newspapers she should buy every day to maximize expected profits. (c) Calculate the merchant’s expected profits for the optimal order quantity. (d) The merchant has always purchased 13 newspapers, thinking that the best way to maximize profits was to always meet the demand.…arrow_forwardA researcher investigated whether a father's level of optimism was predictive of his son's optimism as a young adult. Twenty (20) fathers and sons who agreed to participate in the study were administered a scale measuring their current level of optimism (the scale ranged from 10 to 50), with higher scores indicating greater optimism.arrow_forward
arrow_back_ios
SEE MORE QUESTIONS
arrow_forward_ios
Recommended textbooks for you

 Principles of Economics (12th Edition)EconomicsISBN:9780134078779Author:Karl E. Case, Ray C. Fair, Sharon E. OsterPublisher:PEARSON
 Engineering Economy (17th Edition)EconomicsISBN:9780134870069Author:William G. Sullivan, Elin M. Wicks, C. Patrick KoellingPublisher:PEARSON
 Principles of Economics (MindTap Course List)EconomicsISBN:9781305585126Author:N. Gregory MankiwPublisher:Cengage Learning
 Managerial Economics: A Problem Solving ApproachEconomicsISBN:9781337106665Author:Luke M. Froeb, Brian T. McCann, Michael R. Ward, Mike ShorPublisher:Cengage Learning
 Managerial Economics & Business Strategy (Mcgraw-...EconomicsISBN:9781259290619Author:Michael Baye, Jeff PrincePublisher:McGraw-Hill Education
Principles of Economics (12th Edition)
Economics
ISBN:9780134078779
Author:Karl E. Case, Ray C. Fair, Sharon E. Oster
Publisher:PEARSON
Engineering Economy (17th Edition)
Economics
ISBN:9780134870069
Author:William G. Sullivan, Elin M. Wicks, C. Patrick Koelling
Publisher:PEARSON
Principles of Economics (MindTap Course List)
Economics
ISBN:9781305585126
Author:N. Gregory Mankiw
Publisher:Cengage Learning
Managerial Economics: A Problem Solving Approach
Economics
ISBN:9781337106665
Author:Luke M. Froeb, Brian T. McCann, Michael R. Ward, Mike Shor
Publisher:Cengage Learning
Managerial Economics & Business Strategy (Mcgraw-...
Economics
ISBN:9781259290619
Author:Michael Baye, Jeff Prince
Publisher:McGraw-Hill Education
Hypothesis Testing using Confidence Interval Approach; Author: BUM2413 Applied Statistics UMP;https://www.youtube.com/watch?v=Hq1l3e9pLyY;License: Standard YouTube License, CC-BY
Hypothesis Testing - Difference of Two Means - Student's -Distribution & Normal Distribution; Author: The Organic Chemistry Tutor;https://www.youtube.com/watch?v=UcZwyzwWU7o;License: Standard Youtube License