Concept explainers
Interpretation:
The given table is to be completed. Also, the temperature when volume is zero needs to be determined.
Concept introduction:
The line-graph helps to calculate the missing values.
Explanation of Solution
The given data is as follows:
| Trial | Temperature | Volume |
| 1 | 300 | 48 |
| 2 | 175 | 37 |
| 3 | 110 | y |
| 4 | 0 | 22 |
| 5 | x | 15 |
| 6 | -150 | 11 |
The graph can be plotted as follows:
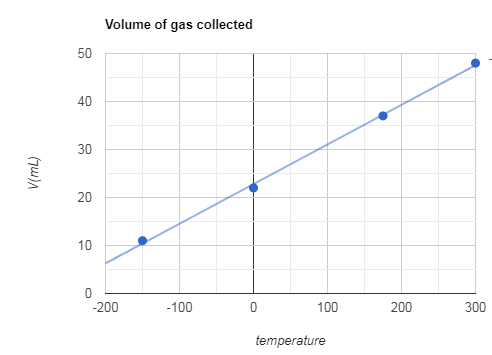
From the given graph, the temperature at 15 mL volume is approximately 95 oC. Thus, the value of x in the table is 95 oC. Also, the volume at 110 oC is 35 mL. On extrapolating the graph, the temperature at which volume reaches zero is
Chapter 13 Solutions
Glencoe Chemistry: Matter and Change, Student Edition
Additional Science Textbook Solutions
Organic Chemistry
Organic Chemistry (9th Edition)
CHEMISTRY-TEXT
Chemistry: A Molecular Approach (4th Edition)
Chemistry: Structure and Properties (2nd Edition)
Chemistry: The Central Science (13th Edition)


 ChemistryChemistryISBN:9781305957404Author:Steven S. Zumdahl, Susan A. Zumdahl, Donald J. DeCostePublisher:Cengage Learning
 ChemistryChemistryISBN:9781259911156Author:Raymond Chang Dr., Jason Overby ProfessorPublisher:McGraw-Hill Education
 Principles of Instrumental AnalysisChemistryISBN:9781305577213Author:Douglas A. Skoog, F. James Holler, Stanley R. CrouchPublisher:Cengage Learning
 Organic ChemistryChemistryISBN:9780078021558Author:Janice Gorzynski Smith Dr.Publisher:McGraw-Hill Education
 Chemistry: Principles and ReactionsChemistryISBN:9781305079373Author:William L. Masterton, Cecile N. HurleyPublisher:Cengage Learning
 Elementary Principles of Chemical Processes, Bind...ChemistryISBN:9781118431221Author:Richard M. Felder, Ronald W. Rousseau, Lisa G. BullardPublisher:WILEY