
Mathematical Statistics with Applications
7th Edition
ISBN: 9780495110811
Author: Dennis Wackerly, William Mendenhall, Richard L. Scheaffer
Publisher: Cengage Learning
expand_more
expand_more
format_list_bulleted
Videos
Textbook Question
Chapter 1.2, Problem 8E
An article in Archaeometry presented an analysis of 26 samples of Romano–British pottery, found at four different kiln sites in the United Kingdom. The percentage of aluminum oxide in each of the 26 samples is given below:
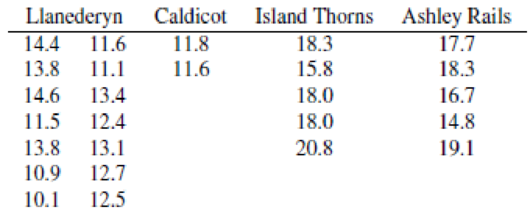
Source: A. Tubb, A. J. Parker, and G. Nickless, “The Analysis of Romano–British Pottery by Atomic Absorption Spectrophotometry,” Archaeometry 22 (1980): 153.
- a Construct a relative frequency histogram to describe the aluminum oxide content of all 26 pottery samples.
- b What unusual feature do you see in this histogram? Looking at the data, can you think of an explanation for this unusual feature?
Expert Solution & Answer
Want to see the full answer?
Check out a sample textbook solution
Students have asked these similar questions
Use the following scenario to respond to questions 6 & 7:
Ferulic acid is a compound that may play a role in disease resistance in corn. A botanist measured the
concentration of soluble ferulic acid (nmol acid per gm tissue) in corn seedlings grown in the dark or in a
light/dark photoperiod. The data are shown in the table below:
Sample 1: Dark
92
117
88
91
107
109
100
101
87
87
Sample 2:
Photoperiod
111
127
104
115
129
124
123
121
120
117
Use R to construct a 95% confidence interval for the difference in ferulic acid concentration under the two
conditions. Assume the two populations from which the data came are normally distributed. (Round your final
answer to 1 place after the decimal.)
95% confidence interval: (
b) The stem and leaf below show the amount of magnesium found in a brand of bottled
water in milligrams.
Exhibit 1
Stem-and-Leaf Display: Amount of Magnesium
Leaf Unit
0.1
N = a
3
345
11
00278888
(13)
3
0113334577899
4
122245777
12
23344
7
11237
2
7
45
i.
What advantage does preparing a stem and leaf diagram have over grouping a data set
using a grouped frequency distribution?
Find the value of a and b
What is the largest value in the dataset?
What the is median of the data displayed?
ii.
iii.
iv.
V.
What is the mode of the distribution?
1.7 Fisher's irises: Sir Ronald Aylmer Fisher was an English statistician, evolutionary biologist, and geneticist who worked on a data set that contained sepal length and width, and petal length and width from three species of iris flowers (setosa, versicolor and virginica). There were 58 flowers from each species in the data set.
a) How many cases were included in the data? b) How many numerical variables are included in the data? Indicate what they are, and if they are continuous or discrete.
Four continuous variables: sepal length, sepal width, petal length, and petal width
Two discrete variables: sepal and petal
Two continuous variables: length and width
Four discrete variables: sepal length, sepal width, petal length, and petal width
c) How many categorical variables are included in the data, and what are they? List the corresponding levels (categories).
Three categorical variables: setosa, versicolor, and virginica
Two categorical variables: species (levels: setosa,…
Chapter 1 Solutions
Mathematical Statistics with Applications
Ch. 1.1 - For each of the following situations, identify the...Ch. 1.2 - Are some cities more windy than others? Does...Ch. 1.2 - Of great importance to residents of central...Ch. 1.2 - The top 40 stocks on the over-the-counter (OTC)...Ch. 1.2 - Given here is the relative frequency histogram...Ch. 1.2 - The relative frequency histogram given next was...Ch. 1.2 - The self-reported heights of 105 students in a...Ch. 1.2 - An article in Archaeometry presented an analysis...Ch. 1.3 - Resting breathing rates for college-age students...Ch. 1.3 - It has been projected that the average and...
Ch. 1.3 - The following results on summations will help us...Ch. 1.3 - Prob. 12ECh. 1.3 - Prob. 13ECh. 1.3 - Refer to Exercise 1.3 and repeat parts (a) and (b)...Ch. 1.3 - Refer to Exercise 1.4 and repeat parts (a) and (b)...Ch. 1.3 - Prob. 16ECh. 1.3 - Prob. 17ECh. 1.3 - Prob. 18ECh. 1.3 - Prob. 19ECh. 1.3 - Prob. 20ECh. 1.3 - The manufacturer of a new food additive for beef...Ch. 1 - Prove that the sum of the deviations of a set of...Ch. 1 - The mean duration of television commercials is 75...Ch. 1 - Aqua running has been suggested as a method of...Ch. 1 - The following data give the lengths of time to...Ch. 1 - Prob. 26SECh. 1 - Prob. 27SECh. 1 - The discharge of suspended solids from a phosphate...Ch. 1 - Prob. 29SECh. 1 - Compared to their stay-at-home peers, women...Ch. 1 - Prob. 31SECh. 1 - Prob. 32SECh. 1 - Prob. 33SECh. 1 - Prob. 34SECh. 1 - Prob. 35SECh. 1 - Prob. 36SECh. 1 - Prob. 37SECh. 1 - Prob. 38SE
Knowledge Booster


Learn more about
Need a deep-dive on the concept behind this application? Look no further. Learn more about this topic, statistics and related others by exploring similar questions and additional content below.Similar questions
- A class of N = 60 students is surveyed using a SRSWOR of n=10 students. The sampled students were asked about various things, including whether or not they owned a car, whether they smoked, and how much they had earned during the university term-time(not in vacations). The results are in Table 4. Table 4: Students survey data Student i 1 2 3 4 5 6 7 8 9 10 -45025 Sex M M M M F F F F F F Age 25 40 21 19 18 23 39 32 20 27 iii) mean earning of all students. UTV iv) total earning of all students. Own car 0 0 1 1 1 1 0 1 1 0 10 Earnings ($) Smoke 1500 12000 0 2500 0 0 1800 6000 0 41000 1 0 0 a) How many possible samples are there? b) what is the probability of selection of any given sample? c) Using the given sample data, make estimates of the following quantities: i) mean of female students. ii) mean of male students. 0 0 0 0 1 1 0 2022 v) variance of estimator of total earning and place a bound on your error of estimation (where s 1.708×10%).arrow_forwardSeveral methods of estimating the number of seeds in soil samples have been developed by ecologists. An article gave the accompanying data on the number of seeds detected by the direct method and by the stratified method for 27 soil specimens. Specimen 1 2 3 4 5 6 7 8 9 10 11 12 13 14 Direct 21 33 0 60 20 61 40 8 13 93 1 68 77 21 Stratified 8 37 8 57 53 61 28 8 8 100 0 57 68 53 Specimen 15 Find the test statistic. (Round your answer to two decimal places.) t = 16 17 18 19 20 21 22 23 24 25 26 27 Direct Find the df. (Round your answer down to the nearest whole number.) df = 33 0 37 17 93 1 40 21 0 8 13 Use technology to find the P-value. (Round your answer to four decimal places.) P-value = 17 40 Stratified 28 0 37 13 93 13 48 21 0 13 40 Do the data provide sufficient evidence to conclude that the mean number of seeds detected differs for the two methods? Test the relevant hypotheses using a = 0.05. (Use direct stratified.) 13 77arrow_forwardSamples of both surface soil and subsoil were taken from eight randomly selected agricultural locations in a particular county. The soil samples were analyzed to determine both surface pH and subsoil pH, with the results shown in the accompanying table. 2. 3. 6. Location Surface pH 6.55 5.98 5.59 6.17 5.92 6.18 6.43 5.68 Subsoil pH 6.78 6.14 5.80 5.91 6.10 6.01 6.18 5.88 a. Compute a 90% confidence interval for the mean differend between surface and subsoil pH for agricultural land in this county. b. What assumptions are necessary for the interval in Part (a) to be valid?arrow_forward
- Use the information provided below to answer questions 1 to 6. As part of a pilot study aimed at determining the daily consumption of water (in litres) across selected suburbs of Johannesburg, Johannesburg Water SOC Ltd (JW), a municipal entity, collected the sample data shown in Table 1 below. Class (L) 100 < 150 150 < 200 200 < 250 250 < 300 300 < 350 350 < 400 Total Question 1 Table 1: Daily consumption of water (in litres) Question 2 Frequency, f Midpoint, m 40 W 130 X 75 A 244.1L B 262.9L C 240.9L D 252.3L 35 Σf Question 3 125 175 225 275 325 375 Determine the missing values represented by W, X, Y, and Z. A W = 118; X = 102; Y = 35 450 and Z = 6 923 750 BW= 102; X = 118; Y = 32 450 and Z = 8 923 750 C W = 105; X = 115; Y = 32 450 and Z = 8 923 750 D W = 102; X = 118; Y = 37 450 and Z = 6 923 750 A 243.1L B 241.5L C 247.9L D 238.3L fm 5 000 17 850 29 250 Y 24 375 13 125 Σfm Using the sample data in Table 1 above, determine the mean daily consumption of water. fm² 625 000 3 123 750…arrow_forwardThe Wind Mountain excavation site in New Mexico is an important archaeological location of the ancient Native American Anasazi culture. The following data represent depths (in cm) below surface grade at which significant artifacts were discovered at this site (Reference: A.I. Woosley and A.J. McIntyre, Mimbres Mogollon Archaeology, University of New Mexico Press). 85 45 75 60 90 90 115 30 55 58 78 120 80 65 65 140 65 50 30 125 75 137 80 120 15 45 70 65 50 45 95 70 70 28 40 125 105 75 80 70 90 68 73 75 55 70 95 65 200 75 15 90 46 33 100 65 60 55 85 50 10 68 99 145 45 75 45 95 85 65 65 52 82 For this problem, use seven classes. (a) Find the class width.(b) Make a frequency table showing class limits, class boundaries, midpoints, frequencies, relative frequencies, and cumulative frequencies. (Give relative frequencies to 4 decimal places.)arrow_forwardWinter visitors are extremely important to the economy of Southwest Florida. Hotel occupancy is an often-reported measure of visitor volume and visitor activity. Hotel occupancy data for February in two consecutive years are as follows. current year previous year occupied rooms 1470 1458 total rooms 1750 1800 a.) Formulate the hypothesis test that can be used to determine if there has been an increase in the proportion of rooms occupied over the one-year period. b.) What is the estimated proportion of hotel rooms occupied each year? c.) Using a 0.05 level of significance, what is your hypothesis test conclusion? What is the p-value? d.) What is the 95% confidence interval estimate of the change in occupancy for the one-year period?arrow_forward
- L IL tO page O Page view A Read al 5. Identify each of the following examples as attribute (qualitative) or numerical (quantitative) variables. a) The residence hall for each student in a statistics class. b) The amount of gasoline pumped by the next 10 customers at the local Unimart. c) The amount of radon in the basement of each of 25 homes in a new development.arrow_forwardPlease use the accompanying Excel data set or accompanying Text file data set when completing the following exercise. An article in the Journal of Sound and Vibration (Vol. 151, 1991, pp. 383-394) described a study investigating the relationship between noise exposure and hypertension. The following data are representative of those reported in the article. ух 1 60 5 85 0 63 4 89 1 65 6 90 2 70 8 90 5 70 4 90 1 70 5 90 4 80 7 94 6 90 9 100 2 80 7 100 3 80 6 100 Fit a linear regression model relating blood pressure rise in millimeters of mercury (y) to sound pressure level in decibels (x) using least squares. (a) Draw a scatter diagram of y versus x (using statistical software). Does a simple linear regression model seem reasonable in this situation? yes (b) Calculate the least squares estimate of the slope. B, = i (Round your answer to 3 decimal places.) (c) Calculate the least squares estimate of the intercept. P, = (Round your answer to 3 decimal places.) (d) Calculate an estimate of…arrow_forwardSonya collected data on the shoe size worn by each member of her class. She sees that John wears a size 9 shoe. What type of data are these? 1.primary aggregate data 2.secondary aggregate data 3.primary microdata 4.secondary microdataarrow_forward
- Do you find any association between the tempers of brothers and sisters from the foHowing data : Good-natured brothers and good-natured sisters 1230 Good-natured brothers and sulien sisters Sullen brothers and good-natured sisters Sullen brothers and sullen sisters 850 530 980arrow_forwardSeveral methods of estimating the number of seeds in soil samples have been developed by ecologists. An article gave the accompanying data on the number of seeds detected by the direct method and by the stratified method for 27 soil specimens. Specimen Direct Stratified 1 21 7 2 34 38 3 0 7 4 60 58 5 20 54 6 61 61 7 40 27 8 7 7 9 14 7 10 94 100 11 1 0 12 67 58 13 78 67 14 21 54 Specimen Direct Stratified 15 34 27 16 0 0 17 38 38 18 18 14 19 94 94 20 1 14 21 40 47 22 21 21 23 0 0 24 7 14 25 14 40 26 18 14 27 40 78 Do the data provide sufficient evidence to conclude that the mean number of seeds detected differs for the two methods? Test the relevant hypotheses using ? = 0.05. (Use ?direct − ?stratified.) Find the test statistic. (Round your answer to two decimal places.) t = Find the df. (Round your answer down to the nearest whole number.) df = Use technology to find the P-value. (Round your answer to four…arrow_forward2. An engineer suspects that the surface finish of metal parts is influenced by the type of paint used and the drying time. He selected three drying times-20, 25, and 30 minutes-and used two types of paint. Three parts are tested with each combination of paint type and drying time. The data are as follows: Drying Time (min) Paint 20 25 30 1 74 73 78 64 61 85 50 44 92 92 98 66 86 73 45 68 88 85 a. State the hypotheses of interest in this experiment. b. Test the above hypotheses and draw conclusions using the analysis of variance with a = 0.05.arrow_forward
arrow_back_ios
SEE MORE QUESTIONS
arrow_forward_ios
Recommended textbooks for you
 MATLAB: An Introduction with ApplicationsStatisticsISBN:9781119256830Author:Amos GilatPublisher:John Wiley & Sons Inc
 Probability and Statistics for Engineering and th...StatisticsISBN:9781305251809Author:Jay L. DevorePublisher:Cengage Learning
 Statistics for The Behavioral Sciences (MindTap C...StatisticsISBN:9781305504912Author:Frederick J Gravetter, Larry B. WallnauPublisher:Cengage Learning
 Elementary Statistics: Picturing the World (7th E...StatisticsISBN:9780134683416Author:Ron Larson, Betsy FarberPublisher:PEARSON
 The Basic Practice of StatisticsStatisticsISBN:9781319042578Author:David S. Moore, William I. Notz, Michael A. FlignerPublisher:W. H. Freeman
 Introduction to the Practice of StatisticsStatisticsISBN:9781319013387Author:David S. Moore, George P. McCabe, Bruce A. CraigPublisher:W. H. Freeman
MATLAB: An Introduction with Applications
Statistics
ISBN:9781119256830
Author:Amos Gilat
Publisher:John Wiley & Sons Inc
Probability and Statistics for Engineering and th...
Statistics
ISBN:9781305251809
Author:Jay L. Devore
Publisher:Cengage Learning
Statistics for The Behavioral Sciences (MindTap C...
Statistics
ISBN:9781305504912
Author:Frederick J Gravetter, Larry B. Wallnau
Publisher:Cengage Learning
Elementary Statistics: Picturing the World (7th E...
Statistics
ISBN:9780134683416
Author:Ron Larson, Betsy Farber
Publisher:PEARSON
The Basic Practice of Statistics
Statistics
ISBN:9781319042578
Author:David S. Moore, William I. Notz, Michael A. Fligner
Publisher:W. H. Freeman
Introduction to the Practice of Statistics
Statistics
ISBN:9781319013387
Author:David S. Moore, George P. McCabe, Bruce A. Craig
Publisher:W. H. Freeman
Hypothesis Testing using Confidence Interval Approach; Author: BUM2413 Applied Statistics UMP;https://www.youtube.com/watch?v=Hq1l3e9pLyY;License: Standard YouTube License, CC-BY
Hypothesis Testing - Difference of Two Means - Student's -Distribution & Normal Distribution; Author: The Organic Chemistry Tutor;https://www.youtube.com/watch?v=UcZwyzwWU7o;License: Standard Youtube License