
Concept explainers
Videos
(a)
To find: The null and alternative hypotheses for the part (a) and part (b) of referred Exercise 12.35.
(a)
Answer to Problem 42E
Solution: The null and alternative hypotheses for part (a) are given below:
The null and alternative hypotheses for part (b) are given below:
Explanation of Solution
Calculation: For part (a), the null hypothesis represents that there is no difference between average score of brown eyes and average score of other two eye colors, while the alternative hypothesis assumes that there is significant difference between average score of brown eyes and average score of other two eye colors. That is,
The null hypothesis would be
Against the alternative hypothesis:
For part (b), the null hypothesis assumes that there is no difference there is no difference between average score of gaze eyes and average score of other three eye colors, that is, blue, green, and brown when the model is looking at you versus model looking downwards, while the alternative hypothesis assumes that that there is significant difference between average score of gaze eyes and average score of other three eye colors, that is, blue, green, and brown when the model is looking at you versus model looking down wards. That is,
The null hypothesis would be
Against the alternative hypothesis:
Interpretation: Null hypothesis for both the parts represents the zero difference. Alternative hypothesis for part (a) represents that there is some difference between the average score of brown eyes and average score of blue and green eyes and alternative hypothesis for part (b) represents that there is some difference between the mean score of gazed eyes and other three eye colors when the model is looking at you versus model looking down wards.
(b)
To find: The values for the sample contrasts
(b)
Answer to Problem 42E
Solution: The value of sample contrast
Explanation of Solution
Calculation: The sample contrast can be calculated by using the formula given below:
Sample contrast for the part (a) of referred Exercise 12.35 can be calculated given below:
where the coefficients are taken from the solution of part (a) of exercise 35, which are given below:
So, the contrast is calculated as shown below:
Sample contrast for the part (b) of referred Exercise 12.35 can be calculated as given below:
where the coefficients are taken from the solution of part (b) of exercise 35, which are given below:
So, the contrast is calculated as shown below:
(c)
To find: The standard errors for the contrast expression of part (a) and part (b) of referred Exercise 12.35.
(c)
Answer to Problem 42E
Solution: The standard error for the contrast
Explanation of Solution
Calculation: Standard error for any contrast can be calculated by using the formula mentioned below:
where
Standard error for the first contrast can be calculated by using the formula given below:
Pooled standard deviation for part (a) of exercise 35 can be calculated by using the formula mentioned below:
Further standard error can be calculated as
Standard error for the first contrast of part (b) of the problem 35 can be calculated by using the formula given below:
Pooled standard deviation for part (b) of exercise 35 can be calculated by using the formula mentioned below:
Further standard error can be calculated as
Interpretation: Therefore, it can be concluded that for the first contrast, the estimated value of standard deviation is 0.315 and for the second contrast, the estimated value of standard deviation is 0.287.
(d)
To find: The test statistics and the P-values for the two tests.
(d)
Answer to Problem 42E
Solution: For the first contrast, the test statistics and the P-value is 0.619 and 0.268, respectively. For the second contrast, the test statistic and the P-value is 1.67 and 0.048, respectively.
Explanation of Solution
Calculation: The test statistic can be calculated by using following formula, which is mentioned below:
The test statistic for the first contrast can be calculated by the formula given below:
The total
The degree of freedom for contrast can be obtained as shown below:
The P-value can also be calculated by the software Microsoft Excel by using the following command:
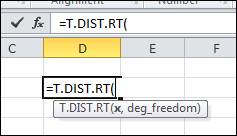
Insert the values of x and degree of freedom which are 0.619 and 178, respectively and press enter. The output is shown below in the snapshot:
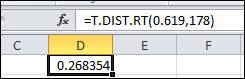
Hence, the P- value is obtained as 0.268, which is greater than the significance level 0.05.
The test statistic for the second contrast can be calculated by the formula given below:
The total sample size for second contrast is 222. There are four groups, which are represented by k.
The degree of freedom for second contrast can be obtained as shown below:
The P-value can also be calculated by the software Microsoft Excel by using the following command:
Insert the values of x and degree of freedom which are 1.67 and 218, respectively and press enter. The output is shown below in the snapshot:
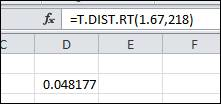
Hence, the P- value is obtained as 0.048, which is less than the significance level 0.05.
Interpretation: For the first contrast, the result is not significant but for the second contrast the result is significant.
(e)
To find: The 95% confidence interval for both the contrast.
(e)
Answer to Problem 42E
Solution: The 95% interval for the first contrast
Explanation of Solution
Calculation: The confidence interval for the first contrast
The confidence interval for the second contrast
Interpretation: Therefore, it can be concluded that for the first contrast, 95% of the time mean value lies between the values 0 and 0.39. Also, for the second contrast, 95% of the time mean value lies between the values 0.001 and 0.959.
Want to see more full solutions like this?
Chapter 12 Solutions
Introduction to the Practice of Statistics: w/CrunchIt/EESEE Access Card


- Please show as much work as possible to clearly show the steps you used to find each solution. If you plan to use a calculator, please be sure to clearly indicate your strategy. Consider the following game. It costs $3 each time you roll a six-sided number cube. If you roll a 6 you win $15. If you roll any other number, you receive nothing. a) Find the expected value of the game. b) If you play this game many times, will you expect to gain or lose money?arrow_forward= 12:02 WeBWorK / 2024 Fall Rafeek MTH23 D02 / 9.2 Testing the Mean mu / 3 38 WEBWORK Previous Problem Problem List Next Problem 9.2 Testing the Mean mu: Problem 3 (1 point) Test the claim that the population of sophomore college students has a mean grade point average greater than 2.2. Sample statistics include n = 71, x = 2.44, and s = 0.9. Use a significance level of a = 0.01. The test statistic is The P-Value is between : The final conclusion is < P-value < A. There is sufficient evidence to support the claim that the mean grade point average is greater than 2.2. ○ B. There is not sufficient evidence to support the claim that the mean grade point average is greater than 2.2. Note: You can earn partial credit on this problem. Note: You are in the Reduced Scoring Period. All work counts for 50% of the original. Preview My Answers Submit Answers You have attempted this problem 0 times. You have unlimited attempts remaining. . Oli wwm01.bcc.cuny.eduarrow_forwardThere are four white, fourteen blue and five green marbles in a bag. A marble is selected from the bag without looking. Find the odds of the following: The odds against selecting a green marble. The odds in favour of not selecting a green marble The odds in favor of the marble selected being either a white or a blue marble. What is true about the above odds? Explainarrow_forward
- Please show as much work as possible to clearly show the steps you used to find each solution. If you plan to use a calculator, please be sure to clearly indicate your strategy. 1. The probability of a soccer game in a particular league going into overtime is 0.125. Find the following: a. The odds in favour of a game going into overtime. b. The odds in favour of a game not going into overtime. c. If the teams in the league play 100 games in a season, about how many games would you expect to go into overtime?arrow_forwardexplain the importance of the Hypothesis test in a business setting, and give an example of a situation where it is helpful in business decision making.arrow_forwardA college wants to estimate what students typically spend on textbooks. A report fromthe college bookstore observes that textbooks range in price from $22 to $186. Toobtain a 95% confidence level for a confidence interval estimate to plus or minus $10,how many students should the college survey? (We may estimate the populationstandard deviation as (range) ÷ 4.)arrow_forward
- In a study of how students give directions, forty volunteers were given the task ofexplaining to another person how to reach a destination. Researchers measured thefollowing five aspects of the subjects’ direction-giving behavior:• whether a map was available or if directions were given from memory without a map,• the gender of the direction-giver,• the distances given as part of the directions,• the number of times directions such as “north” or “left” were used,• the frequency of errors in directions. Identify each of the variables in this study, and whether each is quantitative orqualitative. For each quantitative variable, state whether it is discrete or continuous. Was this an observational study or an experimental study? Explain your answer.arrow_forwardexplain the difference between the confident interval and the confident level. provide an example to show how to correctly interpret a confidence interval.arrow_forwardSketch to scale the orbit of Earth about the sun. Graph Icarus’ orbit on the same set of axesWhile the sun is the center of Earth’s orbit, it is a focus of Icarus’ orbit. There aretwo points of intersection on the graph. Based on the graph, what is the approximate distance between the two points of intersection (in AU)?arrow_forward
- The diameters of ball bearings are distributed normally. The mean diameter is 67 millimeters and the standard deviation is 3 millimeters. Find the probability that the diameter of a selected bearing is greater than 63 millimeters. Round to four decimal places.arrow_forwardSuppose you like to keep a jar of change on your desk. Currently, the jar contains the following: 22 Pennies 27 Dimes 9 Nickels 30 Quarters What is the probability that you reach into the jar and randomly grab a penny and then, without replacement, a dime? Express as a fraction or a decimal number rounded to four decimal places.arrow_forwardA box contains 14 large marbles and 10 small marbles. Each marble is either green or white. 9 of the large marbles are green, and 4 of the small marbles are white. If a marble is randomly selected from the box, what is the probability that it is small or white? Express as a fraction or a decimal number rounded to four decimal places.arrow_forward
 MATLAB: An Introduction with ApplicationsStatisticsISBN:9781119256830Author:Amos GilatPublisher:John Wiley & Sons Inc
 Probability and Statistics for Engineering and th...StatisticsISBN:9781305251809Author:Jay L. DevorePublisher:Cengage Learning
 Statistics for The Behavioral Sciences (MindTap C...StatisticsISBN:9781305504912Author:Frederick J Gravetter, Larry B. WallnauPublisher:Cengage Learning
 Elementary Statistics: Picturing the World (7th E...StatisticsISBN:9780134683416Author:Ron Larson, Betsy FarberPublisher:PEARSON
 The Basic Practice of StatisticsStatisticsISBN:9781319042578Author:David S. Moore, William I. Notz, Michael A. FlignerPublisher:W. H. Freeman
 Introduction to the Practice of StatisticsStatisticsISBN:9781319013387Author:David S. Moore, George P. McCabe, Bruce A. CraigPublisher:W. H. Freeman