Managerial Accounting: Creating Value in a Dynamic Business Environment
12th Edition
ISBN: 9781260417074
Author: HILTON, Ronald
Publisher: MCGRAW-HILL HIGHER EDUCATION
expand_more
expand_more
format_list_bulleted
Videos
Textbook Question
Chapter 12, Problem 30E
The following data pertain to the Waikiki Sands Hotel for the month of March.
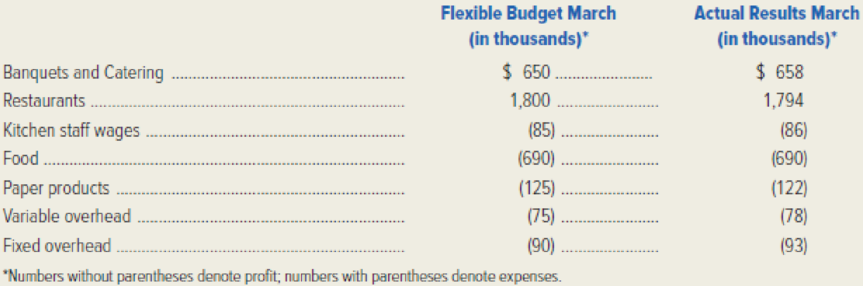
Required: Prepare a March performance report similar to the lower portion of Exhibit 12–4. The report should have six numerical columns with headings analogous to those in Exhibit 12–4. Your performance report should cover only the Food and Beverage Department and the Kitchen. Draw arrows to show the relationships between the numbers in the report. Refer to Exhibit 12–4 for guidance. For the year-to-date columns in your report, use the data given in Exhibit 12–4. You will need to update those figures using the March data given above.
Expert Solution & Answer
Want to see the full answer?
Check out a sample textbook solution
Students have asked these similar questions
When a company has post-acquisition expenditures related to Property, Plant, and Equipment it must determine whether the amount
should be expensed as an ordinary repair or capitalized as a major repair, addition, or betterment. This requires considering the nature
of the expenditure and the use of judgment.
Many companies use a threshold amount. Any expenditure below the threshold is expensed. Items over the threshold are examined
and a decision is made about whether to expense or capitalize the item. This approach is justified by both materiality and considering
costs and benefits. For example, a company with $94 million in net property, plant, and equipment and $250 million of operating
expenses would not consider a $100 repair as material. Plus, if the company had to spend thousands of dollars examining every repair
expenditure, the costs of doing the analysis could easily outweigh the benefits.
SouthEast Equipment has a large number of machines and equipment that are available for…
to create a model for a production cost report using the weighted average method for the month of May. Following good Excel design techniques, you should have an input area in which you put the department information for the month, and an output area that calculates the production cost report. As always, you should have only formulas or references in your output area. You should also include directions (in a text box) for users.
After completion of the production cost report using the weighted average method, create a new worksheet and label the tab “FIFO”. Create a production cost report using the same information using the FIFO method.
Spartans Bakery has two department: mixing and baking. All products start in the Mixing Department, where materials are added and conversion costs (labor, overhead) are incurred. Once the product is “finished” with regards to the Mixing, it moves to the Baking Department where additional conversion costs are incurred before moving to Finished…
Jay Corporation has provided data from a two-year period to aid in planning. The Controller has asked you to prepare a contribution format income statement. Use the information included in the Excel Simulation and the Excel functions described below to complete the task.
Chapter 12 Solutions
Managerial Accounting: Creating Value in a Dynamic Business Environment
Ch. 12 - Why is goal congruence important to an...Ch. 12 - Define and give examples of the following terms:...Ch. 12 - Prob. 3RQCh. 12 - Explain the relationship between performance...Ch. 12 - Prob. 5RQCh. 12 - What is the key feature of activity-based...Ch. 12 - Prob. 7RQCh. 12 - Define and give examples of the following terms:...Ch. 12 - Give an example of a common resource in an...Ch. 12 - Explain how and why cost allocation might be used...
Ch. 12 - Define the term cost allocation base. What would...Ch. 12 - Referring to Exhibit 125, why are marketing costs...Ch. 12 - Prob. 13RQCh. 12 - Why do some managers and accountants choose not to...Ch. 12 - Why is it important in responsibility accounting...Ch. 12 - Prob. 16RQCh. 12 - Prob. 17RQCh. 12 - Prob. 18RQCh. 12 - Prob. 19RQCh. 12 - Prob. 21RQCh. 12 - Prob. 22RQCh. 12 - Prob. 23RQCh. 12 - Define the term manufacturing cycle efficiency.Ch. 12 - Prob. 25RQCh. 12 - What is meant by aggregate productivity, and what...Ch. 12 - For each of the following organizational subunits,...Ch. 12 - Prob. 28ECh. 12 - Prob. 29ECh. 12 - The following data pertain to the Waikiki Sands...Ch. 12 - Lackawanna Community College has three divisions:...Ch. 12 - Countywide Cable Services, Inc. is organized with...Ch. 12 - Prob. 36ECh. 12 - Prob. 37ECh. 12 - Prob. 38ECh. 12 - Prob. 39PCh. 12 - Prob. 40PCh. 12 - Prob. 41PCh. 12 - Rocky Mountain General Hospital serves three...Ch. 12 - Refer to the organization chart for Rocky Mountain...Ch. 12 - Prob. 44PCh. 12 - Buckeye Department Stores, Inc. operates a chain...Ch. 12 - Building Services, Co. (BSC) was started a number...Ch. 12 - Warriner Equipment Company, which is located in...Ch. 12 - Prob. 49PCh. 12 - MedTech, Inc. manufactures diagnostic testing...Ch. 12 - Prob. 51PCh. 12 - Cathys Classic Clothes is a retailer that sells to...Ch. 12 - Pacific Rim Industries is a diversified company...
Knowledge Booster


Learn more about
Need a deep-dive on the concept behind this application? Look no further. Learn more about this topic, accounting and related others by exploring similar questions and additional content below.Similar questions
- Prepare a performance report for the dining room of Barbaras Bistro for the month of February 2016, using the following data:arrow_forwardThe Northwest regional manager of Logan Outdoor Equipment Company has conducted a study to determine how her store managers are allocating their time. A study was undertaken over three weeks that collected the following data related to the percentage of time each store manager spent on the tasks of attending required meetings, preparing business reports, customer interaction, and being idle. The results of the data collection appear in the following table: a. Create a stacked-bar chart with locations along the vertical axis. Reformat the bar chart to best display these data by adding axis labels, a chart title, and so on. b. Create a clustered-bar chart with locations along the vertical axis and clusters of tasks. Reformat the bar chart to best display these data by adding axis labels, a chart title, and the like. c. Create multiple bar charts in which each location becomes a single bar chart showing the percentage of time spent on tasks. Reformat the bar charts to best display these data by adding axis labels, a chart title, and so forth. d. Which form of bar chart (stacked, clustered, or multiple) is preferable for these data? Why? e. What can we infer about the differences among how store managers are allocating their time at the different locations?arrow_forwardPintura Company implemented a quality improvement program and tracked the following for the five years: By cost category as a percentage of sales for the same period of time: Required: 1. Prepare a bar graph that reveals the trend in quality cost as a percentage of sales (time on the horizontal axis and percentages on the vertical). Comment on the message of the graph. 2. Prepare a bar graph for each cost category as a percentage of sales. What does this graph tell you?arrow_forward
- You have recently been appointed as the accountant attached to the head office of the company with the specific responsibility of monitoring the performance of the companies within the group. Each company is treated as an investment center and every month produces an operating statement for the group headquarters. Summaries of the statements for companies A and B which make similar products selling at similar prices for the last month showed a typical situation. Extract from the company monthly operating statements. A B GHS000 GHS000 Sales 600 370 Less variable cost 229 208 Contribution 371 162 Less controllable fixed overheads…arrow_forwardYou are reviewing all customer complaints received in any one of your stores in a 12 month period. You want to know if there is a certain time of the working week in which you receive more complaints. please RANK the weekdays from the HIGHEST complaints reported to the LOWEST complaints reported for the last 8 months of the year.arrow_forwardYou have recently been appointed as the management accountant attached to the head office of the company with special responsibility of monitoring the performance of the companies within the group. Each company is treated as an investment center and every month produces an operating statement for the group headquarters. Summaries of the statements for companies X and Y which make similar products selling at similar prices for the last month showed a typical situation. Extract from the company monthly operating statements. X Y GHS000 GHS000 Sales 600 370 Less variable cost 229 208 Contribution 371 162 Less controllable fixed…arrow_forward
- Comfort Plus, Inc., has a hotel with 300 rooms in a metropolitan city. Its main competitor, Connors Hotel, has a hotel with 350 rooms in the same city. The following operating data are available for April for the two hotels: a. Determine the guest nights for each hotel in April. b. Determine the available room nights for each hotel in April. c. Determine the occupancy rate for each hotel in April. d. Which hotel has the better utilization of capacity in April?arrow_forwardGreiner Company makes and sells high-quality glare filters for microcomputer monitors. John Craven, controller, is responsible for preparing Greiners master budget and has assembled the following data for the coming year. The direct labor rate includes wages, all employee-related benefits, and the employers share of FICA. Labor saving machinery will be fully operational by March. Also, as of March 1, the companys union contract calls for an increase in direct labor wages that is included in the direct labor rate. Greiner expects to have 5,600 glare filters in inventory on December 31 of the current year, and has a policy of carrying 35 percent of the following month's projected sales in inventory. Information on the first four months of the coming year is as follows: Required: 1. Prepare the following monthly budgets for Greiner Company for the first quarter of the coming year. Be sure to show supporting calculations. a. Production budget in units b. Direct labor budget in hours c. Direct materials cost budget d. Sales budget 2. Calculate the total budgeted contribution margin for Greiner Company by month and in total for the first quarter of the coming year. Be sure to show supporting calculations. (CMA adapted)arrow_forwardGary is the cafeteria manager at the Sunshine Community Hospital. He is reviewing the sales and cost records for the months of June and July. His manager has provided him with food and labor cost control standards for the cafeteria so that Gary can accurately analyze this information. Sunshine Community Hospital Public Cafeteria Cost Control Standards Food cost percentage should be lower than 32 percent. Labor cost percentage should be between 24 and 26 percent. Table is attached. Given the information provided, please answer the following questions: What is the cafeteria’s food cost for June? What is the cafeteria’s food cost For July? What is the cafeteria’s food cost percentage for June? What is the cafeteria’s food cost percentage for July? What is the cafeteria’s labor cost for June? What is the cafeteria’s labor cost for July? What is the cafeteria’s labor cost percentage for June? What is the cafeteria’s labor cost…arrow_forward
- Kim Epson operates a full-service car wash, which operates from 8 A.M. to 8 P.M. seven days a week. The car wash has two stations: an automatic washing and drying station that can handle 30 cars per hour and an interior cleaning station that can handle 210 cars per day. Based on a recent year-end review of operations, Kim estimates that future demand for the interior cleaning station for the seven days of the week, expressed in the average number of cars per day, would be as follows: Q i Kim should Day Cars should not Mon. 160 Tues. 180 Wed. 150 Thurs. 140 Fri. 260 By installing additional equipment (at a cost of $90,000) Kim can increase the capacity of the interior cleaning to 300 cars per day. Each car wash generates a pretax contribution of $5.00. Should Kim install the additional equipment if she expects a pretax payback period of three years or less? install the additional equipment because the payback period is years. (Enter your response rounded to two decimal places.) Sat. 270…arrow_forwardRoss Company implemented a quality improvement program and tracked the following for the five years: By cost category as a percentage of sales for the same period of time: Required: 1. Prepare a bar graph that reveals the trend in quality cost as a percentage of sales (time on the horizontal axis and percentages on the vertical). Comment on the message of the graph. 2. Prepare a bar graph for each cost category as a percentage of sales. What does this graph tell you? 3. What if management would like to have the trend in relative distribution of quality costs? Express this as a bar graph and comment on its significance.arrow_forwardDevelop a cost reconciliation for the assembly department for the month of April.arrow_forward
arrow_back_ios
SEE MORE QUESTIONS
arrow_forward_ios
Recommended textbooks for you
 Managerial AccountingAccountingISBN:9781337912020Author:Carl Warren, Ph.d. Cma William B. TaylerPublisher:South-Western College Pub
 Financial And Managerial AccountingAccountingISBN:9781337902663Author:WARREN, Carl S.Publisher:Cengage Learning,
 Excel Applications for Accounting PrinciplesAccountingISBN:9781111581565Author:Gaylord N. SmithPublisher:Cengage Learning
 Managerial Accounting: The Cornerstone of Busines...AccountingISBN:9781337115773Author:Maryanne M. Mowen, Don R. Hansen, Dan L. HeitgerPublisher:Cengage Learning
 Cornerstones of Cost Management (Cornerstones Ser...AccountingISBN:9781305970663Author:Don R. Hansen, Maryanne M. MowenPublisher:Cengage Learning
 Essentials of Business Analytics (MindTap Course ...StatisticsISBN:9781305627734Author:Jeffrey D. Camm, James J. Cochran, Michael J. Fry, Jeffrey W. Ohlmann, David R. AndersonPublisher:Cengage Learning
Managerial Accounting
Accounting
ISBN:9781337912020
Author:Carl Warren, Ph.d. Cma William B. Tayler
Publisher:South-Western College Pub
Financial And Managerial Accounting
Accounting
ISBN:9781337902663
Author:WARREN, Carl S.
Publisher:Cengage Learning,
Excel Applications for Accounting Principles
Accounting
ISBN:9781111581565
Author:Gaylord N. Smith
Publisher:Cengage Learning
Managerial Accounting: The Cornerstone of Busines...
Accounting
ISBN:9781337115773
Author:Maryanne M. Mowen, Don R. Hansen, Dan L. Heitger
Publisher:Cengage Learning
Cornerstones of Cost Management (Cornerstones Ser...
Accounting
ISBN:9781305970663
Author:Don R. Hansen, Maryanne M. Mowen
Publisher:Cengage Learning
Essentials of Business Analytics (MindTap Course ...
Statistics
ISBN:9781305627734
Author:Jeffrey D. Camm, James J. Cochran, Michael J. Fry, Jeffrey W. Ohlmann, David R. Anderson
Publisher:Cengage Learning
What is Business Analysis?; Author: WolvesAndFinance;https://www.youtube.com/watch?v=gG2WpW3sr6k;License: Standard Youtube License