
Concept explainers
Videos
In a study conducted by Zogby International for the Democrat and Chronicle, more than 700 New Yorkers were polled to determine whether the New York state government works. Respondents surveyed were asked questions involving pay cuts for state legislators, restrictions on lobbyists, term limits for legislators, and whether state citizens should be able to put matters directly on the state ballot for a vote. The results regarding several proposed reforms had broad support, crossing all demographic and political lines.
Suppose that a follow-up survey of 100 individuals who live in the western region of New York was conducted. The party affiliation (Democrat, Independent, Republican) of each individual surveyed was recorded, as well as their responses to the following three questions.
- 1. Should legislative pay be cut for every day the state budget is late?
Yes ____ No ____
- 2. Should there be more restrictions on lobbyists?
Yes ____ No ____
- 3. Should there be term limits requiring that legislators serve a fixed number of years?
Yes ____ No ____
The responses were coded using 1 for a Yes response and 2 for a No response. The complete data set is available in the file NYReform.
Managerial Report
- 1. Use descriptive statistics to summarize the data from this study. What are your preliminary conclusions about the independence of the response (Yes or No) and party affiliation for each of the three questions in the survey?
- 2. With regard to question 1, test for the independence of the response (Yes and No) and party affiliation. Use α = .05.
- 3. With regard to question 2, test for the independence of the response (Yes and No) and party affiliation. Use α = .05.
- 4. With regard to question 3, test for the independence of the response (Yes and No) and party affiliation. Use α = .05.
- 5. Does it appear that there is broad support for change across all political lines? Explain.
1.
Find the descriptive statistics to summarize the data from the study.
Explain about the preliminary conclusions about the independence of the response and party affiliation for each of the three questions in the survey.
Explanation of Solution
Calculation:
The given data are related to the survey of 100 individuals, who were asked three questions. The response was coded using “1” for “Yes” response and “2” for “No” response.
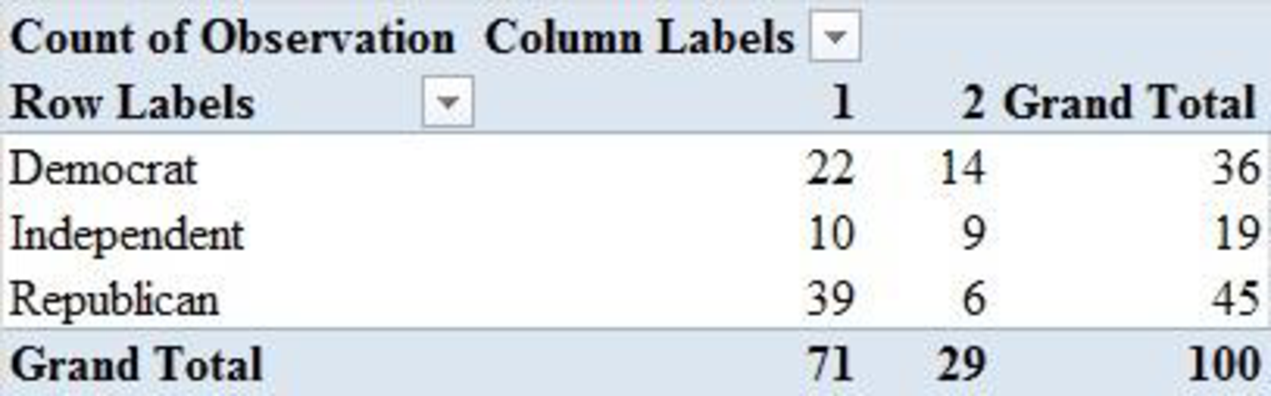
The variable ‘Pay Cut?’ represents the response of the question “Should legislative pay be cut for every day the state budget is late?”.
Contingency table:
Software procedure:
Step-by-step software procedure to obtain contingency table using EXCEL software is as follows:
- Open an EXCEL sheet.
- Enter the data as Observation in column A, Party in column B, Pay Cut? in column C, Lobbyists? in column D and Term Limits? in column E.
- Select the all data.
- Choose Insert > PivotTable.
- Under Select a table or range in Table/Range enter Data!$A$1:$E$101.
- Choose New Worksheet.
- Click OK.
- In new sheet enter Party as Row Labels.
- In new sheet enter Pay Cut? as Column Labels.
- In new sheet enter Observation as Values.
- Choose Values > Sum of Observation > Value Field Settings.
- Select Summarize value field by > Count.
- Click OK.
- Output using EXCEL software is given below:
Now, the percentages of responses for the question “Should legislative pay be cut for every day the state budget is late?” are obtained as follows:
| Party | Yes (%) | No (%) |
| Democrat | ||
| Independent | ||
| Republican |
Thus, it can be concluded that since the percentage of Republicans that answered yes is much greater than the percentage of Democrats or Independents that answered yes, the classifications do not appear to be independent.
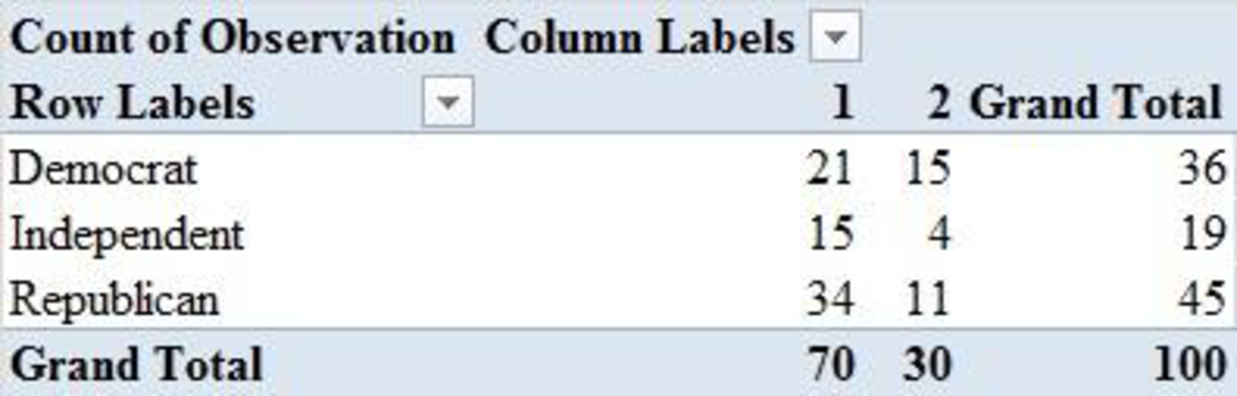
The variable ‘Lobbyists?’ represents the response of the question “Should there be more restriction on lobbyists?”.
Software procedure:
Step-by-step software procedure to obtain contingency table using EXCEL software is as follows:
- Open an EXCEL sheet.
- Enter the data as Observation in column A, Party in column B, Pay Cut? in column C, Lobbyists? in column D and Term Limits? in column E.
- Select the all data.
- Choose Insert > PivotTable.
- Under Select a table or range in Table/Range enter Data!$A$1:$E$101.
- Choose New Worksheet.
- Click OK.
- In new sheet enter Party as Row Labels.
- In new sheet enter Lobbyists? as Column Labels.
- In new sheet enter Observation as Values.
- Choose Values > Sum of Observation > Value Field Settings.
- Select Summarize value field by > Count.
- Click OK.
- Output using EXCEL software is given below:
Now, the percentages of responses for the question “Should there be more restriction on lobbyists?” are obtained as follows:
| Party | Yes (%) | No (%) |
| Democrat | ||
| Independent | ||
| Republican |
Thus, it can be concluded that since the percentage of Democrats that answered yes is much less than the percentage of Independents or Republicans that answered yes, the classifications do not appear to be independent.
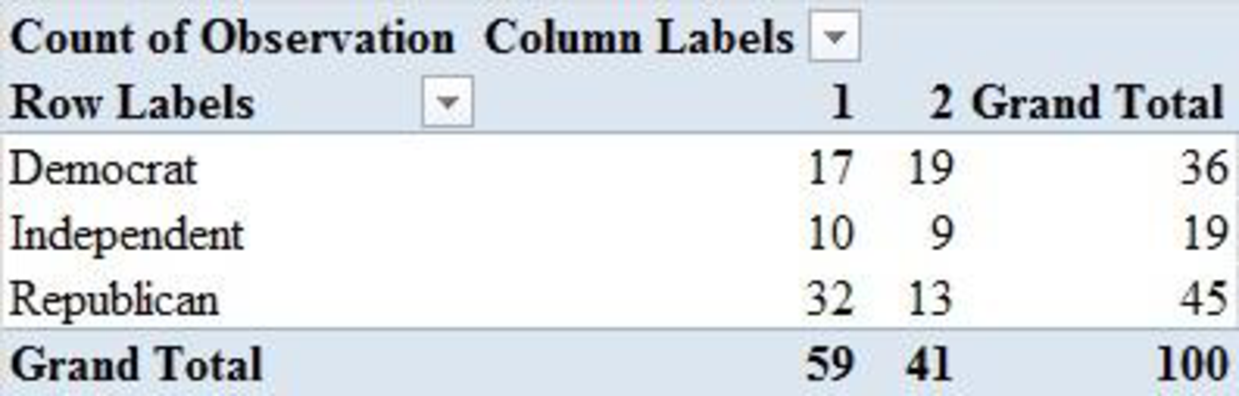
The variable ‘Term Limits?’ represents the response of the question “Should there be term limits requiring that legislators serve a fixed number of years?”.
Contingency table:
Software procedure:
Step-by-step software procedure to obtain contingency table using EXCEL software is as follows:
- Open an EXCEL sheet.
- Enter the data as Observation in column A, Party in column B, Pay Cut? in column C, Lobbyists? in column D and Term Limits? in column E.
- Select the all data.
- Choose Insert > PivotTable.
- Under Select a table or range in Table/Range enter Data!$A$1:$E$101.
- Choose New Worksheet.
- Click OK.
- In new sheet enter Party as Row Labels.
- In new sheet enter Term Limits? as Column Labels.
- In new sheet enter Observation as Values.
- Choose Values > Sum of Observation > Value Field Settings.
- Select Summarize value field by > Count.
- Click OK.
- Output using EXCEL software is given below:
Now, the percentages of responses for the question “Should there be term limits requiring that legislators serve a fixed number of years?” are obtained as follows:
| Party | Yes (%) | No (%) |
| Democrat | ||
| Independent | ||
| Republican |
Thus, it can be concluded that since the percentage of Republicans that answered yes is much higher than the percentage of Democrats or Independents that answered yes, the classifications do not appear to be independent.
2.
Perform a test for the independence of the response (Yes or No) and party affiliation with regard to question “Should legislative pay be cut for every day the state budget is late?” at
Answer to Problem 1CP
There is a statistically significant relation between the response (Yes or No) and party affiliation.
Explanation of Solution
Calculation:
State the test hypotheses.
Null hypothesis:
That is, there is no statistically significant relation between the response (Yes or No) and party affiliation.
Alternative hypothesis:
That is, there is a statistically significant relation between the response (Yes or No) and party affiliation.
The row and column total is tabulated below:
| Party | Yes (%) | No (%) | Total |
| Democrat | 22 | 14 | 36 |
| Independent | 10 | 9 | 19 |
| Republican | 39 | 6 | 45 |
| Total | 71 | 29 | 100 |
The formula for expected frequency is given below:
The expected frequency for each category is calculated as follows:
| Party | Yes (%) | No (%) |
| Democrat | ||
| Independent | ||
| Republican |
The formula for chi-square test statistic is given as,
Therefore, the value of chi-square test statistic is,
Thus, the chi-square test statistic is 10.18.
Degrees of freedom:
The degrees of freedom are
Thus, for 3 rows and 2 columns the degrees of freedom are,
Thus, the degree of freedom is 2.
Level of significance:
The given level of significance is
p-value:
Software procedure:
Step -by-step software procedure to obtain p-value using EXCEL software is as follows:
- Open an EXCEL sheet and select cell A1.
- In cell A1 enter the formula =CHISQ.DIST.RT(10.18,2).
- Press Enter.
- Output using EXCEL software is given below:
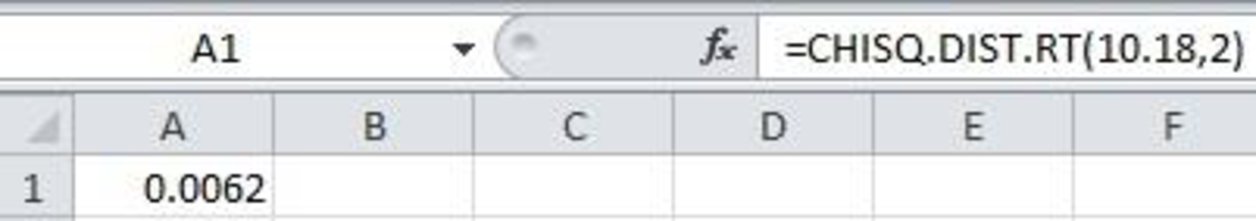
From the EXCEL output, the p-value is 0.0062.
Rejection rule:
- If the
- Otherwise, failed to reject the null hypothesis.
Conclusion:
Here, the p-value is less than the level of significance.
That is,
Thus, the decision is “reject the null hypothesis”.
Therefore, the data provide sufficient evidence to conclude that the responses and party affiliation are not independent.
Thus, there is a statistically significant relation between the response (Yes or No) and party affiliation.
3.
Perform a test for the independence of the response (Yes or No) and party affiliation with regard to question “Should there be more restriction on lobbyists?” at
Answer to Problem 1CP
There is no statistically significant relation between the response (Yes or No) and party affiliation.
Explanation of Solution
Calculation:
State the test hypotheses.
Null hypothesis:
That is, there is no statistically significant relation between the response (Yes or No) and party affiliation.
Alternative hypothesis:
That is, there is no statistically significant relation between the response (Yes or No) and party affiliation.
The row and column total is tabulated below:
| Party | Yes (%) | No (%) | Total |
| Democrat | 21 | 15 | 36 |
| Independent | 15 | 4 | 19 |
| Republican | 34 | 11 | 45 |
| Total | 70 | 30 | 100 |
The formula for expected frequency is given below:
The expected frequency for each category is calculated as follows:
| Party | Yes (%) | No (%) |
| Democrat | ||
| Independent | ||
| Republican |
Therefore, the value of chi-square test statistic is,
Thus, the chi-square test statistic is 3.72.
Degrees of freedom:
The degrees of freedom are
Thus, for 3 rows and 2 columns the degrees of freedom are,
Thus, the degree of freedom is 2.
Level of significance:
The given level of significance is
p-value:
Software procedure:
Step -by-step software procedure to obtain p-value using EXCEL software is as follows:
- Open an EXCEL sheet and select cell A1.
- In cell A1 enter the formula =CHISQ.DIST.RT(3.72,2).
- Press Enter.
- Output using EXCEL software is given below:
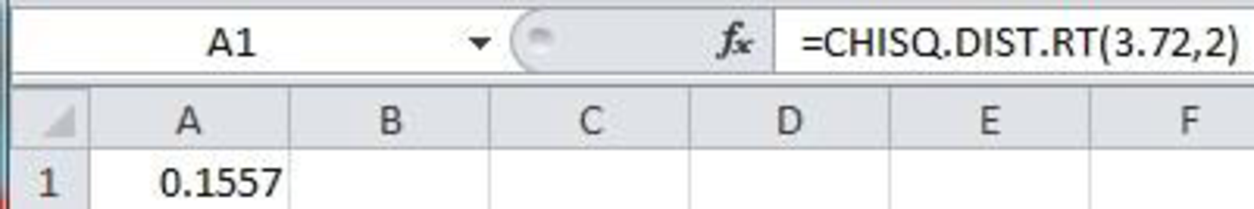
From the EXCEL output, the p-value is 0.1557.
Conclusion:
Here, the p-value is greater than the level of significance.
That is,
Thus, the decision is “Do not reject the null hypothesis”.
Therefore, the data do not provide sufficient evidence to conclude that the responses and party affiliation are not independent.
Thus, there is no statistical significant relation between the response (Yes or No) and party affiliation.
4.
Perform a test for the independence of the response (Yes or No) and party affiliation with regard to question “Should there be term limits requiring that legislators serve a fixed number of years?” at
Answer to Problem 1CP
There is no statistically significant relation between the response (Yes or No) and party affiliation.
Explanation of Solution
Calculation:
State the test hypotheses.
Null hypothesis:
That is, there is no statistical significant relation between the response (Yes or No) and party affiliation.
Alternative hypothesis:
That is, there is a statistically significant relation between the response (Yes or No) and party affiliation.
The row and column total is tabulated below:
| Party | Yes (%) | No (%) | Total |
| Democrat | 17 | 19 | 36 |
| Independent | 10 | 9 | 19 |
| Republican | 32 | 13 | 45 |
| Total | 59 | 41 | 100 |
The formula for expected frequency is given below:
The expected frequency for each category is calculated as follows:
| Party | Yes (%) | No (%) |
| Democrat | ||
| Independent | ||
| Republican |
Therefore, the value of chi-square test statistic is,
Thus, the chi-square test statistic is 5.21.
Degrees of freedom:
The degrees of freedom are
Thus, for 3 rows and 2 columns the degrees of freedom are,
Thus, the degree of freedom is 2.
Level of significance:
The given level of significance is
p-value:
Software procedure:
Step -by-step software procedure to obtain p-value using EXCEL software is as follows:
- Open an EXCEL sheet and select cell A1.
- In cell A1 enter the formula =CHISQ.DIST.RT(5.21,2).
- Press Enter.
- Output using EXCEL software is given below:
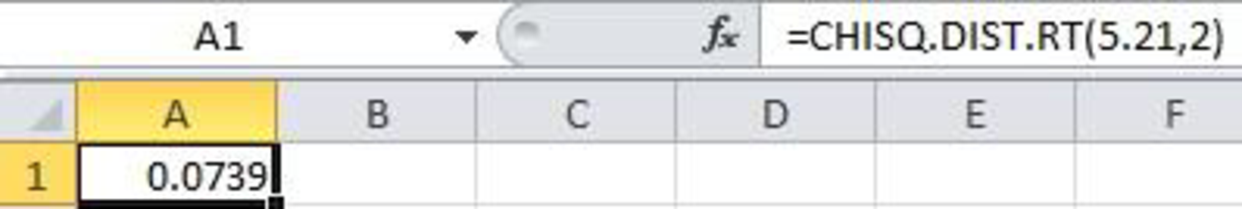
From the EXCEL output, the p-value is 0.0739.
Conclusion:
Here, the p-value is greater than the level of significance.
That is,
Thus, the decision is “Fail to reject the null hypothesis”.
Therefore, the data do not provide sufficient evidence to conclude that the responses and party affiliation are not independent.
Thus, there is no statistically significant relation between the response (Yes or No) and party affiliation.
5.
Explain whether it appears that there is broad support for change across all political lines.
Explanation of Solution
The tests conducted in Parts 3 and 4 do not produce significant p-values and imply that there is no dependence between the party affiliation and opinions regarding the restriction for lobbyists and term limits of legislators.
However, the test conducted in Part 2 suggests that there is a significant relationship between one’s party affiliation and their opinion regarding legislative pay cut. The Republicans appear to be much more in favor of legislative pay cut for everyday state budget than the Democrats or the Independents.
Thus, it appears that there is no broad support for change across all political lines, but only across some political lines.
Want to see more full solutions like this?
Chapter 12 Solutions
Essentials Of Statistics For Business & Economics


- From the Research Question below please provide a list of semi-structured questions to be used in conducting an questionnaire. What are the perceptions of public servants of the recruitment, selection and retention policies and practices in the public service of Monserrat?arrow_forwardThe Entergy Corporation had 2,600,000 electricity customers. Of these, 76.176.1% were in the residential category (R); 13.913.9% were commercial (C); 2.52.5% were industrial (I); and 7.57.5% were government and municipal (G). What is the value of P(C or G)?arrow_forwardConsumer complaints are frequently reported to the better business bureau. In 2011, theindustries with the most complaints to the better business bureau were banks; cable andsatellite television companies; collection agencies; cellular phone providers; and new cardealerships (USA Today, April 16, 2012). The results for a sample of 200 complaints arecontained in the file bbb.a. Show the frequency and percent frequency of complaints by industry.b. Construct a bar chart of the percent frequency distribution.c. which industry had the highest number of complaints?d. Comment on the percentage frequency distribution for complaints.arrow_forward
- ClairLinx Wireless, a start-up cell phone company, has divided its market of potential customers into three major groups: single, working; married, working; and retired. ClairLinx surveyed 500 potential customers and asked each, "Of the following, which do you consider to be the most important feature in a cell phone service plan: free nights and weekends, free long distance and roaming, or free calls to customers with the same company?" Each of the 500 potential customers in the survey was categorized according to the service plan feature she considers most important and the customer group in which she appears. The data are summarized in the contingency table below. In the cells of the table are the respective observed frequencies, and three of the cells also have blanks. Fill in these blanks with the frequencies expected if the two variables, type of potential customer and choice of service plan feature, are independent. Round the responses to at least two decimal places. Note:…arrow_forwardYour local school board wants to determine the proportion of people who plan on voting for the school levy in the upcoming election. They conduct a random phone poll, where they contact 150 individuals and ask them whether or not they plan on voting for the levy. Of these 150 respondents, 78 people say they plan on voting for the levy. The school board wants to determine whether or not the data supports the idea that more than 50% of people plan on voting for the levy. Are all three conditions met for a Hypothesis Test in this scenario? No, only one is met No, none of them are met. No, only two are met. It is impossible to tell Yes, all three are met.arrow_forwardConsumer complaints are frequently reported to the better business bureau. In 2011, theindustries with the most complaints to the better business bureau were banks; cable andsatellite television companies; collection agencies; cellular phone providers; and new cardealerships (USA Today, April 16, 2012). The results for a sample of 200 complaints arecontained in the file bbb.a. Show the frequency and percent frequency of complaints by industry.b. Construct a bar chart of the percent frequency distribution.arrow_forward
- Please list your answers to part a, b, c, and d. Suppose you try to conduct a presidential approval poll of 5,000 likely U.S. voters. You know that 29% of the voters are registered as Republican, 34% are registered as Democrat, and 28% are registered as Independent. If you are going to construct a representative sample of this population, approximately how many of the likely voters in the sample should be: a. Republican b. Democrat c. Independent d. Notice the sum of the percents is not 100. What could account for this?arrow_forwardIn a Gallup telephone survey conducted on April 9–10, 2013, the person being interviewedwas asked if he would vote for a law in his state that would increase the gas tax up to20 cents a gallon, with the new gas tax money going to improve roads and bridges andbuild more mass transportation in his state. Possible responses were vote for, vote against,and no opinion. Two hundred ninety five respondents said they would vote for the law,672 said they would vote against the law, and 51 said they had no opinion (Gallup website,June 14, 2013).a. Do the responses for this question provide categorical or quantitative data?b. What was the sample size for this Gallup poll?c. What percentage of respondents would vote for a law increasing the gas tax?d. Do the results indicate general support for or against increasing the gas tax to improveroads and bridges and build more mass transportation?arrow_forwardIn order to determine how American undergraduate college students feel about eliminating spring break in order to finish spring term a week early, a survey was conducted. 200 undergraduate students from the University of Miami (FL) were interviewed. Both of the interviewers hired to conduct the survey were told to interview 25 freshmen, 25 sophomores, 25 juniors, and 25 seniors. Of the 200 students interviewed, 20% were in favor of the elimination of spring break, 70% were opposed, and 10% had no opinion.The results of this survey are unreliable primarily because of both sample (selection) bias and non-response bias. the absence of a control group. sample (selection) bias only. nonresponse bias only. None of the abovearrow_forward
- In a local election, 56.0% of those aged under 40 and 48.8% of those aged over 40 vote in favor of a certain ballot measure. Are age and "voting in favor" independent? How can you tell?arrow_forwardExecutives at The Thinking Channel have decided to test whether the educational backgrounds of the channel's viewers are different from the educational backgrounds of American adults (ages 25 and over) as a whole. The executives have the following information on the American adult population as a whole, obtained from a recent U.S. Current Population Survey.arrow_forwardAccording to Padgett Business Services, 20% of all small-business owners say the most important advice for starting a business is to prepare for long hours and hard work. Twenty-five percent say the most important advice is to have good financing ready. Nineteen percent say having a good plan is the most important advice; 18% say studying the industry is the most important advice; and 18% list other advice. Suppose 14 small business owners are contacted, and assume that the percentages hold for all small-business owners.a. What is the probability that none of the owners would say preparing for long hours and hard work is the most important advice?b. What is the probability that six or more owners would say preparing for long hours and hard work is the most important advice?c. What is the probability that exactly five owners would say having good financing ready is the most important advice?d. What is the expected number of owners who would say having a good plan is the most important…arrow_forward
 MATLAB: An Introduction with ApplicationsStatisticsISBN:9781119256830Author:Amos GilatPublisher:John Wiley & Sons Inc
 Probability and Statistics for Engineering and th...StatisticsISBN:9781305251809Author:Jay L. DevorePublisher:Cengage Learning
 Statistics for The Behavioral Sciences (MindTap C...StatisticsISBN:9781305504912Author:Frederick J Gravetter, Larry B. WallnauPublisher:Cengage Learning
 Elementary Statistics: Picturing the World (7th E...StatisticsISBN:9780134683416Author:Ron Larson, Betsy FarberPublisher:PEARSON
 The Basic Practice of StatisticsStatisticsISBN:9781319042578Author:David S. Moore, William I. Notz, Michael A. FlignerPublisher:W. H. Freeman
 Introduction to the Practice of StatisticsStatisticsISBN:9781319013387Author:David S. Moore, George P. McCabe, Bruce A. CraigPublisher:W. H. Freeman