
a)
The graph that shows the market for knives and the marginal cost,
a)
Explanation of Solution
The following graph shows a profit-maximizing price and quantity, shaded area of loss, and allocative
Knives’ market H’s cutlery
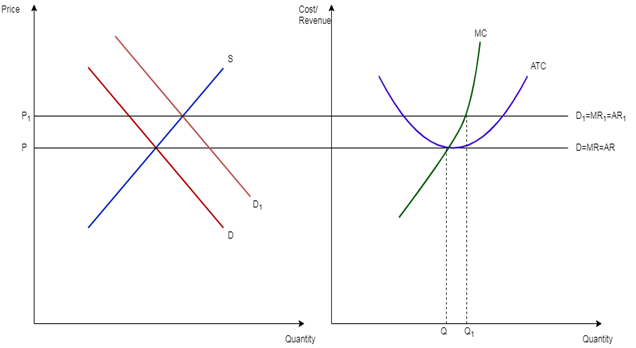
In this graph, the horizontal axis represents the quantity and the vertical axis shows the price, cost/revenue.
The graph represents the demand curve, marginal revenue curve, marginal cost curve, and average total cost curve.
- In the long run, the supply curve of the industry for knives will increase because new firms may enter the market and with the increase in the number of firms, the supply will also rise for the product in the market.
- The price of knives will decrease in the long run because there would be an increase in competition when the number of firms enters the market in the long run which causes a decrease in the price of products.
- H’s cutlery’s output would be smaller when compared to the initial level because in the long run when many firms produce products in the market then the demand may go down for each firm. This will result in a decrease in the output of the firm.
Introduction: The market structure can be determined by several factors such as the number of buyers, sellers, competition, and barriers or freedom to enter or exit. Profit maximization is the situation where a firm earns maximum profit in the market.
b)
The shaded area that represents H's Cutlery's initial economic profit and explains what will happen to it in the long run.
b)
Explanation of Solution
In the following graph, the horizontal axis represents the quantity and the vertical axis shows the price, cost/revenue.
The graph represents the demand curve, marginal revenue curve, marginal cost curve, and average total cost curve where the shaded area is an initial economic profit for the firm which is found below the marginal cost of H’s cutlery.
Knives’ market H’s cutlery
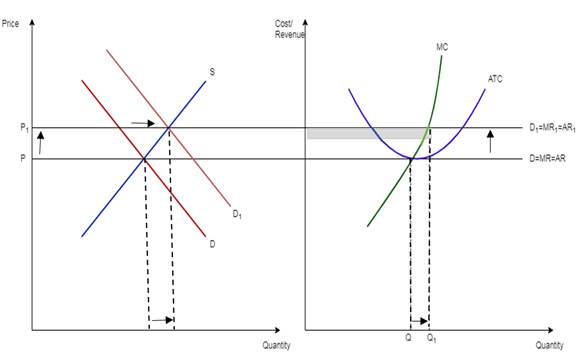
As H’s cutlery’s output would be smaller when compared to the initial level because in the long run when many firms produce products in the market then the demand may go down for each firm. Therefore, it will result in a decrease in the output of the firm in the long run which, in turn, also reduces the economic profit of the firm in long run.
Introduction: The market structure can be determined by a number of factors such as the number of buyers, sellers, competition, and barriers or freedom to enter or exit.
c)
The graph that shows H's Cutlery's output level and price by assuming that H's Cutlery makes a greater than normal economic profit and whether H's Cutlery can produce the allocatively efficient level of output.
c)
Explanation of Solution
The following graph shows H's Cutlery's output level and price by assuming that H's Cutlery makes a greater than normal economic profit.
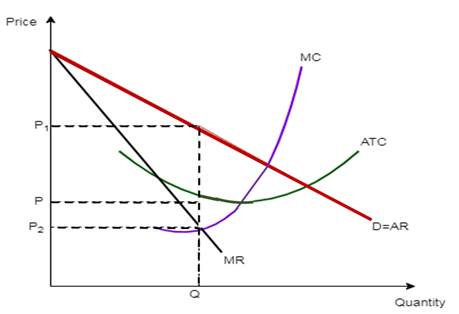
In this graph, the horizontal axis represents the quantity and the vertical axis shows the price, cost/revenue.
According to the graph, H's Cutlery can produce the allocatively efficient level of output where the acceptable price is P2 as marginal revenue is equal to this price and therefore, the quantity would be allocatively efficient at this level.
This is an acceptable efficient level of allocation because allocatively efficient quantity is at the point where the demand and marginal cost are equal.
Introduction: The market structure can be determined by a number of factors such as the number of buyers, sellers, competition, and barriers or freedom to enter or exit.
d)
The shaded area represents
d)
Explanation of Solution
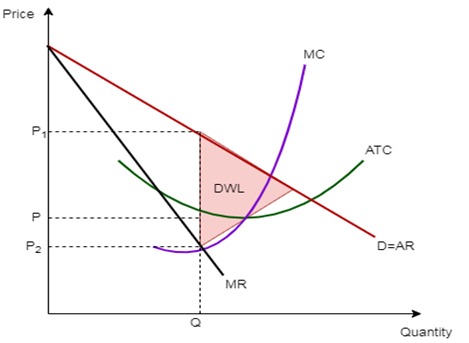
A deadweight loss is a cost to society that is brought on by market inefficiency as it occurs when supply and demand are not balanced.
The shaded area of the triangle formed by the right edge is the deadweight loss which is below the demand curve.
Introduction: The market structure can be determined by a number of factors such as the number of buyers, sellers, competition, and barriers or freedom to enter or exit.
Chapter 11R Solutions
Krugman's Economics For The Ap® Course


 Principles of Economics (12th Edition)EconomicsISBN:9780134078779Author:Karl E. Case, Ray C. Fair, Sharon E. OsterPublisher:PEARSON
 Engineering Economy (17th Edition)EconomicsISBN:9780134870069Author:William G. Sullivan, Elin M. Wicks, C. Patrick KoellingPublisher:PEARSON
 Principles of Economics (MindTap Course List)EconomicsISBN:9781305585126Author:N. Gregory MankiwPublisher:Cengage Learning
 Managerial Economics: A Problem Solving ApproachEconomicsISBN:9781337106665Author:Luke M. Froeb, Brian T. McCann, Michael R. Ward, Mike ShorPublisher:Cengage Learning
 Managerial Economics & Business Strategy (Mcgraw-...EconomicsISBN:9781259290619Author:Michael Baye, Jeff PrincePublisher:McGraw-Hill Education