
Concept explainers
Videos
a.
Find
a.
Answer to Problem 10E
The intercept
The slope
Explanation of Solution
Calculation:
The given information is that the sample data consists of 8 values for x and y.
Slope or
where,
r represents the
Software procedure:
Step-by-step procedure to find the
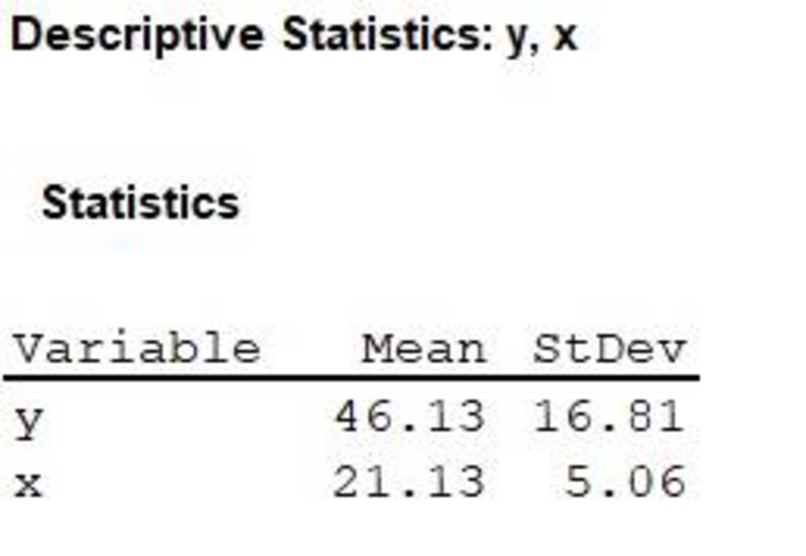
- Choose Stat > Basic Statistics > Display
Descriptive Statistics . - In Variables enter the columns of y and x.
- Choose Options Statistics, select Mean and Standard deviation.
- Click OK.
Output obtained from MINITAB is given below:
Correlation:
Where,
n represents the sample size.
The table shows the calculation of correlation:
| x | y | |||||
| 23 | 51 | 1.87 | 4.87 | 0.369565 | 0.289709 | 0.107066 |
| 16 | 22 | –5.13 | –24.13 | –1.01383 | –1.43546 | 1.455313 |
| 17 | 56 | –4.13 | 9.87 | –0.81621 | 0.587151 | –0.47924 |
| 19 | 34 | –2.13 | –12.13 | –0.42095 | –0.72159 | 0.303754 |
| 30 | 67 | 8.87 | 20.87 | 1.752964 | 1.241523 | 2.176345 |
| 19 | 59 | –2.13 | 12.87 | –0.42095 | 0.765616 | –0.32228 |
| 18 | 55 | –3.13 | 8.87 | –0.61858 | 0.527662 | –0.3264 |
| 27 | 25 | 5.87 | –21.13 | 1.160079 | –1.25699 | –1.45821 |
| Total | 1.456 |
Thus, the correlation is
Substitute r as 0.208,
Thus, the slope
Intercept or
Substitute
Thus, the intercept
b.
Find the predicted value
b.
Answer to Problem 10E
The predicted value
Explanation of Solution
Calculation:
The given value of x is 25.
The estimated regression equation is
Substitute x as 25,
Thus, the predicted value
c.
Find the residual standard deviation
c.
Answer to Problem 10E
The residual standard deviation
Explanation of Solution
Calculation:
The residual standard deviation
Where,
n represents the
Use the estimated regression equation to find the predicted value of y for each value of x.
| y |  | ||
| 51 | 47.423 | 3.577 | 12.79493 |
| 22 | 42.586 | –20.586 | 423.7834 |
| 56 | 43.277 | 12.723 | 161.8747 |
| 34 | 44.659 | –10.659 | 113.6143 |
| 67 | 52.26 | 14.74 | 217.2676 |
| 59 | 44.659 | 14.341 | 205.6643 |
| 55 | 43.968 | 11.032 | 121.705 |
| 25 | 50.187 | –25.187 | 634.385 |
| Total | 1,891.09 |
Substitute
Thus, the residual standard deviation
d.
Find the sum of squares for x.
d.
Answer to Problem 10E
The sum of squares for x is 178.8752.
Explanation of Solution
Calculation:
The table shows the calculation of sum of squares for x:
| x | ||
| 23 | 1.87 | 3.4969 |
| 16 | -5.13 | 26.3169 |
| 17 | -4.13 | 17.0569 |
| 19 | -2.13 | 4.5369 |
| 30 | 8.87 | 78.6769 |
| 19 | -2.13 | 4.5369 |
| 18 | -3.13 | 9.7969 |
| 27 | 5.87 | 34.4569 |
| Total | 178.8752 |
Thus, the sum of squares for x is 178.8752.
e.
Find the critical value for a 95% confidence or prediction interval.
e.
Answer to Problem 10E
The critical value for a 95% confidence or prediction interval is 2.447.
Explanation of Solution
Calculation:
Critical value:
Software procedure:
Step-by-step procedure to find the critical value using MINITAB is given below:
- Choose Graph > Probability Distribution Plot choose View Probability > OK.
- From Distribution, choose ‘t’ distribution.
- In Degrees of freedom, enter 4.
- Click the Shaded Area tab.
- Choose Probability and Two tail for the region of the curve to shade.
- Enter the Probability value as 0.05.
- Click OK.
Output obtained from MINITAB is given below:
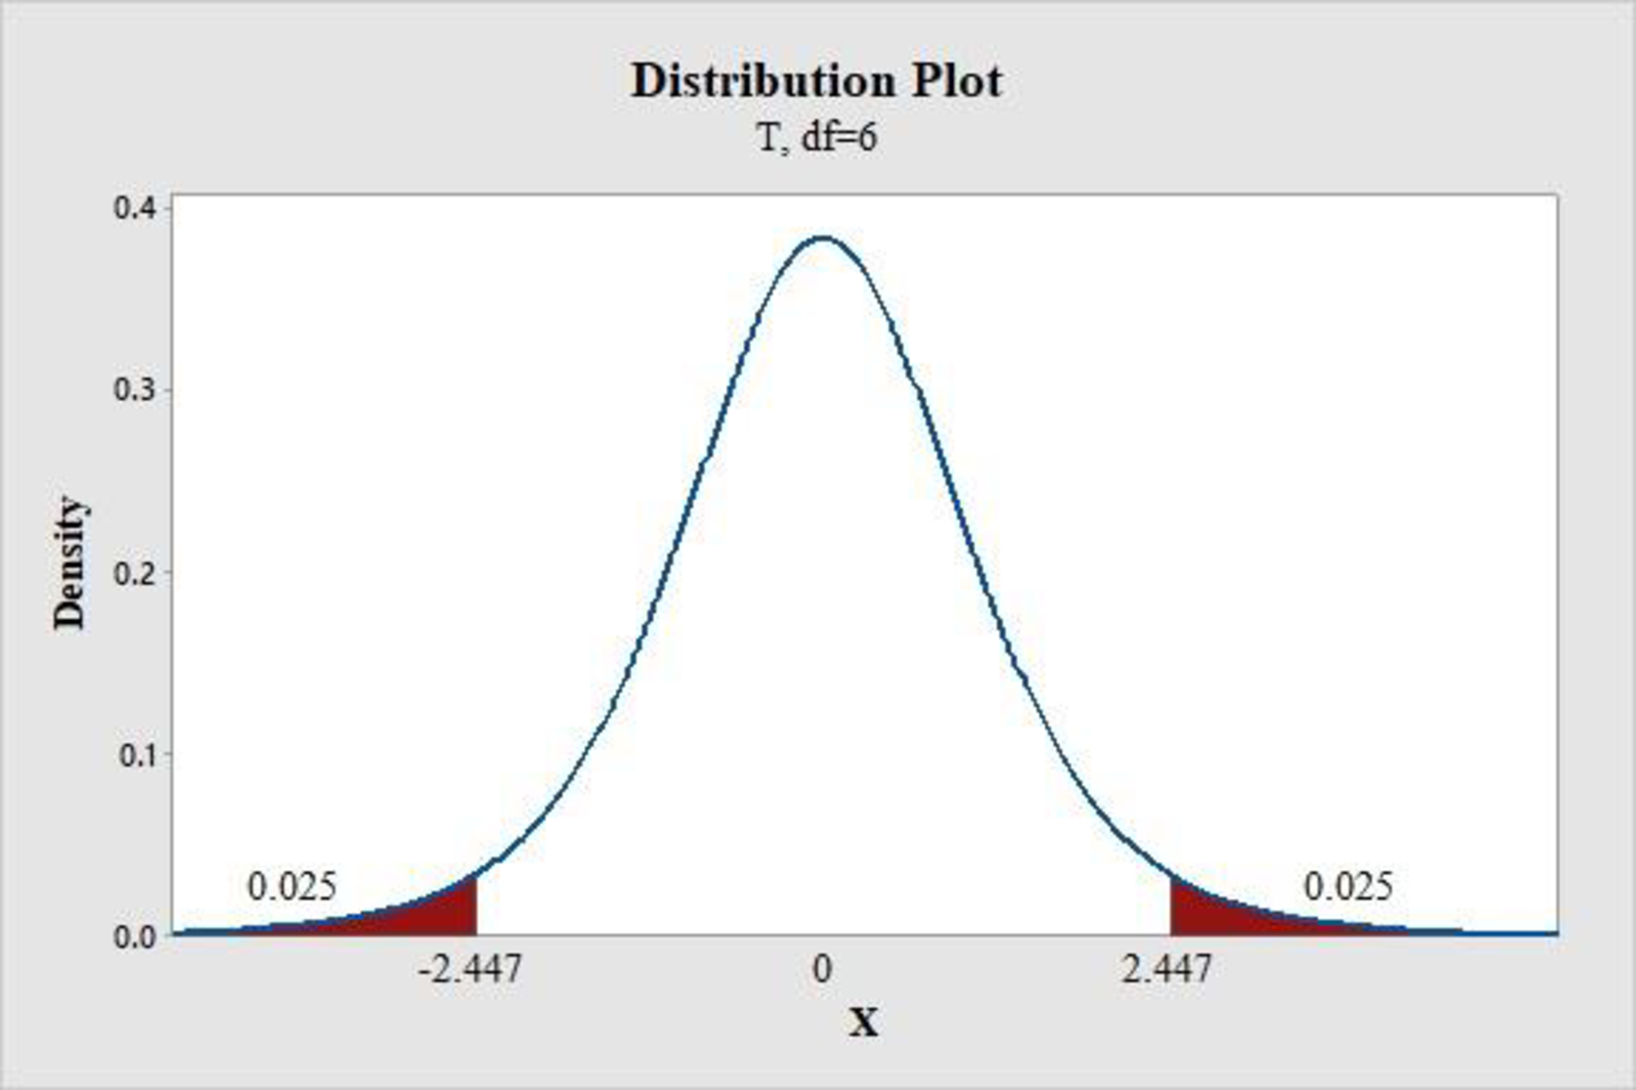
Thus, the critical value for a 95% confidence or prediction interval is 2.447.
f.
Construct the 95% confidence interval for the mean response for the given value of x.
f.
Answer to Problem 10E
The 95% confidence interval for the mean response for the given value of x is
Explanation of Solution
Calculation:
The given value of x is 25.
Software procedure:
Step-by-step procedure to construct the 95% confidence interval for the mean response for the given value of x is given below:
- Choose Stat > Regression > Regression.
- In Response, enter the column containing the y.
- In Predictors, enter the columns containing the x.
- Click OK.
- Choose Stat > Regression > Regression>Predict.
- Choose Enter the individual values.
- Enter the x as 25.
- Click OK.
Output obtained from MINITAB is given below:
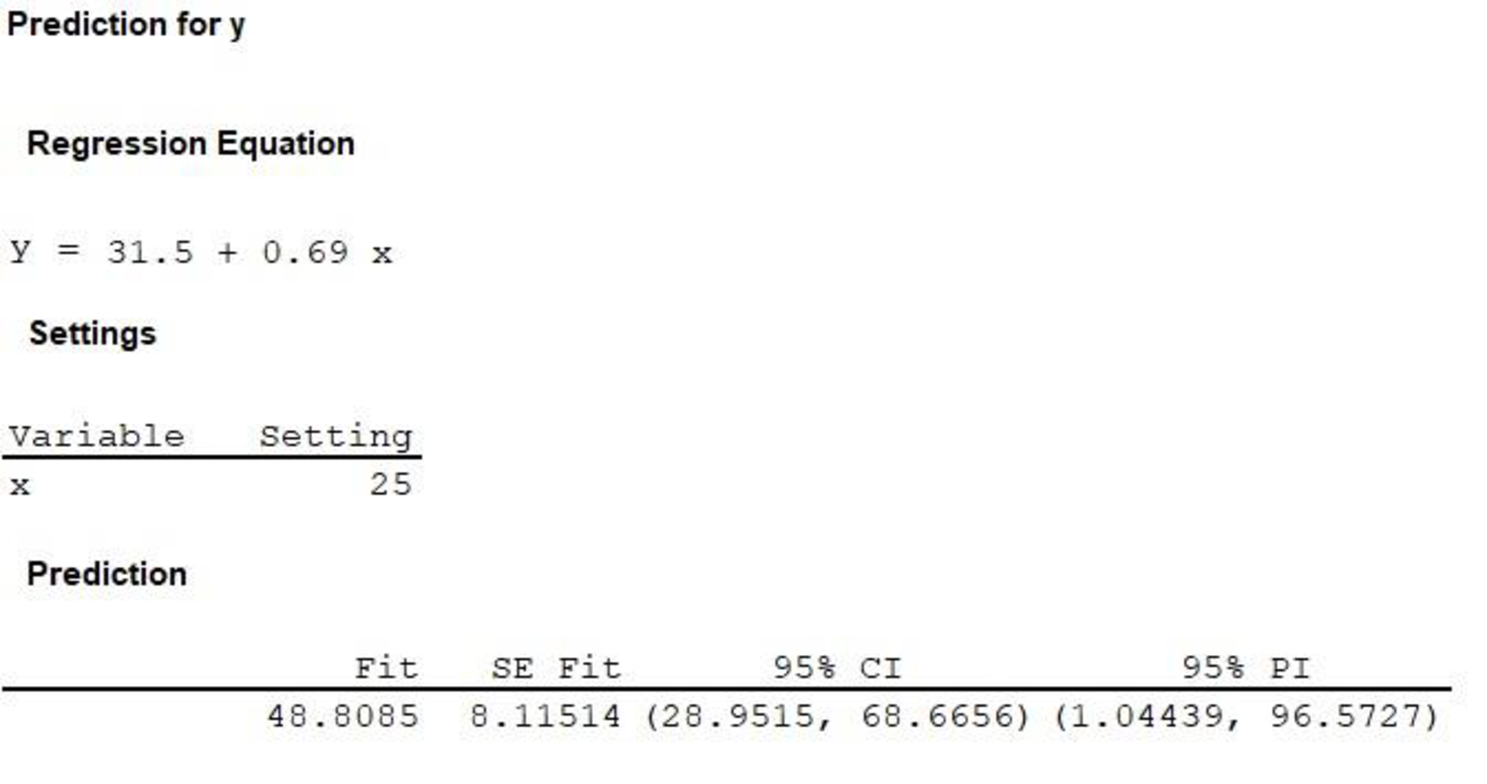
Interpretation:
Thus, the 95% confidence interval for the mean response for the given value of x is
g.
Construct the 95% prediction interval for the individual response for the given value of x.
g.
Answer to Problem 10E
The 95% prediction interval for the individual response for the given value of x is
Explanation of Solution
From the MINITAB output obtained in the previous part (f) it can be observed that the 95% prediction interval for the individual response for the given value of x is
Want to see more full solutions like this?
Chapter 11 Solutions
Essential Statistics


 Glencoe Algebra 1, Student Edition, 9780079039897...AlgebraISBN:9780079039897Author:CarterPublisher:McGraw Hill
 Big Ideas Math A Bridge To Success Algebra 1: Stu...AlgebraISBN:9781680331141Author:HOUGHTON MIFFLIN HARCOURTPublisher:Houghton Mifflin Harcourt
 Holt Mcdougal Larson Pre-algebra: Student Edition...AlgebraISBN:9780547587776Author:HOLT MCDOUGALPublisher:HOLT MCDOUGAL