
Videos
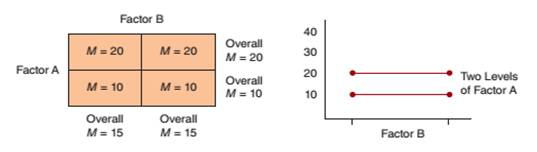
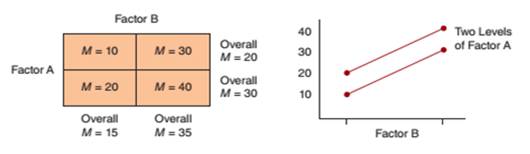
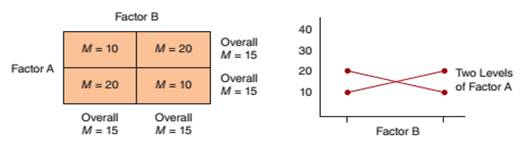
In Figure 11.5, we show three combinations of main effects and interactions for a 2 × 2 factorial design. Using the same 2 × 2 structure, with factor A defining the rows and factor B defining the columns, create a set of means that produce each of the following patterns:
a. A main effect for factors A and B, but no interaction.
b. A main effect for factor A and an interaction, but no main effect for factor B.
c. A main effect for both factors and an interaction.
FIGURE 11.5
Three Possible Combinations of Main Effects and Interactions in a Two-Factor Experiment.
(a) Data showing a main effect for factor A but no main effect for factor B and no interaction.
(b) Data showing main effects for both factor A and factor B but no interaction.
(c) Data showing no main effect for either factor, but an interaction.

Trending nowThis is a popular solution!

Chapter 11 Solutions
Research Methods for the Behavioral Sciences (MindTap Course List)


- Psychologists at Disney World measured factors that affect the scariness of the soundtrack for their Haunted House ride. In particular, they were interested in the loudness of the screams (soft versus loud) and the length of the screams (short versus long). They used a 2 × 2 factorial design to test how these factors combined. They collected data from 10 different riders in each of the four conditions. Each rider rated the scariness of the ride on a nine-point scale. short screams long screams soft screams T=38, n = 10, SS = 13.6 T=64, n = 10, SS = 22.4 loud screams T=52, n=10, SS = 29.6 T=50, n=10, SS = 16.0 For these data: G = 204, N = 40, X2 = 1156. 1. Sketch a dataplot of the mean rating in each condition. 2. Calculate SS total, the total sum of squares 3. Calculate SSwithin, the within-treatments sum of squares. 4. Calculate SSbetween, the between-treatments sum of squares. 5. Calculate SSA the sum of squares for Factor A (length of scream). 6. Calculate SSB, the sum of squares…arrow_forwardCheck whether the representation of pets in the population is different from: dog 41%, cat 33%, fish 10%, other 16%. α = 0.05. I am sending a screenshot with only one PART of the data in the attachmentarrow_forwardThe + sign in the figure is shown using 9 pixels in a 3 X 3 grid. The color levels are given to the right of the figure. Each color is represented by a specific number: 0, 1, 2, or 3. Use this information to solve, a). Find a matrix that represents a digital photograph of the + sign. b). Adjust the contrast by changing the black to dark gray and the light gray to white. Use matrix addition to accomplish this. c). Adjust the contrast by changing the black to light gray and the light gray to dark gray. Use matrix addition to accomplish this.arrow_forward
- Suppose we are recording the lap times of 20 runners in a race and the race is of 12 laps in the race. . The lap times are measurements and the runners are the features. What would be the shape of the data matrix? Select one: O a. 20 x 12 (20 rows and 12 columns). O b. 20 x 20 ( 20 rows and 20 columns) O C. 240 x 1 (240 rows and 1 column). O d. 12 x 20 (12 rows and 20 columns).arrow_forwardThis item has three questions. The matrix represents the results (means) from a 2 x 2 factorial study. One mean is not given. A represents one factor and B represents the other factor. A1 A2 B1 40 20 B2 30 What value for the missing mean would result in no main effect for factor A? Explain. What value for the missing mean would result in no main effect for factor B? Explain. What value for the missing mean would result in no interaction?Explain.arrow_forwardSelect a suitable figure from the four alternatives that would complete the figure matrix. Encircle the letter corresponding to the missing pattern.arrow_forward
- The letter L in Figure is shown using 9 pixels in a 3 x 3 grid. The colors possible in the grid are shown in Figure. Each color is represented by a specific number: 0, 1, 2, or 3. a. Find a matrix that represents a digital photograph of this letter L. b. Increase the contrast of the letter L by changing the dark gray to black and the light gray to white. Use matrix addition to accomplish this.arrow_forwardThe + sign in the figure is shown using 9 pixels in a 3 X 3 grid.The color levels are given to the right of the figure. Each color is represented by a specific number: 0, 1, 2, or 3. a. Find a matrix that represents a digital photograph of the + sign. b. Adjust the contrast by changing the black to dark gray and the light gray to white. Use matrix addition to accomplish this. c. Adjust the contrast by changing the black to light gray and the light gray to dark gray. Use matrix addition to accomplish this.arrow_forwardState the elementary row operations corresponding to D, E, and F.arrow_forward
- Walter is a sales manager for a chain of car dealerships. He encourages the managers at each store to spend as much time on the sales floor as they can. He is curious if this has any effect on the number of cars sold. Each manager reports the number of hours per day he or she spends on the sales floor. From this, Walter creates the scatterplot below showing sales and time on the floor. What information can Walter infer from the scatterplot? Select all that apply. 10 9 8 1 1 3 4 7 Average Hours on Sales Floor O There is a positive correlation between hours on the sales floor and sales. O There is no correlation between hours on the sales floor and sales. O There is a negative correlation between hours on the sales floor and sales. O Walter should require all managers to spend more hours on the sales floor. O Walter should make no changes to policies regarding hours on the sales floor for managers. O Walter should help managers who spend little time on the sales floor find ways to spend…arrow_forwardWhich of the following 3 × 3 matrices are in row-echelon form? Note: Mark all of your choices.arrow_forwardA sports psychologist performed a study of some visualization techniques that she developed to improve athletic performance. She used amateur golfers and amateur tennis players as participants. In her study, 50% of the participants were golfers, and the other 50% were tennis players. (No participant was both a golfer and a tennis player.) The visualization techniques seemed quite helpful for both the golfers and the tennis players: 90% of the golfers reported a solid improvement in their performance after using the visualization techniques, and 85% of the tennis players reported a solid improvement in their performance after using the techniques. Let G denote the event that a randomly chosen participant was a golfer and G denote the event that a randomly chosen participant was a tennis player. Let I denote the event that a randomly chosen participant reported a solid improvement in performance after using the visualization techniques and I denote the event that a randomly chosen…arrow_forward
 College Algebra (MindTap Course List)AlgebraISBN:9781305652231Author:R. David Gustafson, Jeff HughesPublisher:Cengage Learning
 Calculus For The Life SciencesCalculusISBN:9780321964038Author:GREENWELL, Raymond N., RITCHEY, Nathan P., Lial, Margaret L.Publisher:Pearson Addison Wesley,