
To describe:
The equilibrium of the economics graphically.
Marginal propensity for the consumption and the multiplier.
Effect on equilibrium GDP when the price level remain unchanged and government purchases reduced by 60$.
Answer to Problem 2TY
When the government expenditure is reduced by 60$ it leads to the change in the equilibrium level by 120$. Thus, the multiplier effect of govt. purchases on GDP will be 2.
Explanation of Solution
The GDP equilibrium is the equilibrium output of such an economy is that level of output at which the total amount of planned spending is just equal to the amount produced, or GDP. That is, equilibrium
The Economic equilibrium is a condition or state wherein economic powers are adjusted. Economic equilibrium is the mix of economic variables (typically cost and amount) toward which ordinary economic procedures, for example, market interest, drive the economy.
The given below table represents the components of consumption expenditure (Table I)
| GDP | Taxes | DI | C | I | G | (X-IM) |
| 1360 | 320 | 1040 | 810 | 200 | 500 | 30 |
| 1480 | 360 | 1120 | 870 | 200 | 500 | 30 |
| 1600 | 400 | 1200 | 930 | 200 | 500 | 30 |
| 1720 | 440 | 1280 | 990 | 200 | 500 | 30 |
| 1840 | 480 | 1360 | 1050 | 200 | 500 | 30 |
Now employing the information in the above table the consumption expenditure will be composed where consumption expenditure will be given as the sum of C, I, G and
| GDP | Taxes | DI | C | I | G | (X-IM) | Consumption expenditure |
| 1360 | 320 | 1040 | 810 | 200 | 500 | 30 | 1540 |
| 1480 | 360 | 1120 | 870 | 200 | 500 | 30 | 1600 |
| 1600 | 400 | 1200 | 930 | 200 | 500 | 30 | 1660 |
| 1720 | 440 | 1280 | 990 | 200 | 500 | 30 | 1720 |
| 1840 | 480 | 1360 | 1050 | 200 | 500 | 30 | 1780 |
In table 2, the GDP of the economy is equal to that Consumption expenditure when both are 1720$, thus the equilibrium level of GDP is 1720$.
The tax rate can be calculated employing the formula :
The tax rate can be represented in the table (2) as,
| GDP/Income | Tax | Tax rate |
| 1360 | 320 | 23.53 |
| 1480 | 360 | 24.32 |
| 1600 | 400 | 25 |
| 1720 | 440 | 25.58 |
| 1840 | 480 | 26.09 |
| 24.90(124.52/5) |
Thus the average tax rate is 24.90.
The reduction in govt purchase by 60$ will reduce the consumption expenditure. Thus, the new equilibrium level of GDP can be obtained through updating the figure with the new govt. purchases.
| GDP | C | I | G | (X-IM) | Consumption expenditure |
| 1360 | 810 | 200 | 440 | 30 | 1480 |
| 1480 | 870 | 200 | 440 | 30 | 1540 |
| 1600 | 930 | 200 | 440 | 30 | 1600 |
| 1720 | 990 | 200 | 440 | 30 | 1660 |
| 1840 | 1050 | 200 | 440 | 30 | 1720 |
Since the consumption expenditure is equal to that of GDP when both values are at 1600$, the equilibrium level of GDP is 1600. It shows that the reduction in government purchases by 60$ will lead to reduction of equilibrium level by 120.
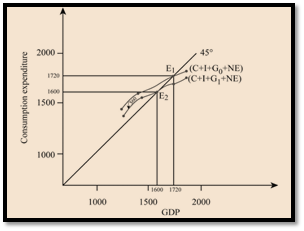
Graphical representation of equilibrium level of GDP : The graph shows the govt expenditure shifted the consumption expenditure curve downward from
Introduction:
Economic equilibrium is a condition or state wherein economic powers are adjusted. Economic equilibrium is the mix of economic variables (typically cost and amount) toward which ordinary economic procedures, for example, market interest, drive the economy.
Want to see more full solutions like this?


 Economics (MindTap Course List)EconomicsISBN:9781337617383Author:Roger A. ArnoldPublisher:Cengage Learning