
Essentials of Statistics (6th Edition)
6th Edition
ISBN: 9780134685779
Author: Mario F. Triola
Publisher: PEARSON
expand_more
expand_more
format_list_bulleted
Videos
Textbook Question
Chapter 11, Problem 2RE
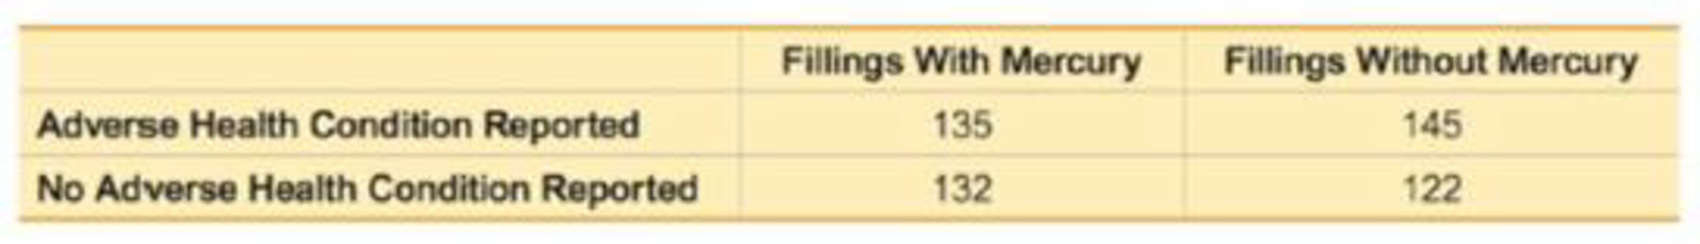
Tooth Fillings The table below shows results from a study in which some patients were treated with fillings that contain mercury and others were treated with fillings that do not contain mercury (based on data from “Neuropsychological and Renal Effects of Dental Amalgam in Children.” By Bellinger et al., Journal of the American Medical Association, Vol. 295, No. 15). Use a 0.05 significance level to test for independence between the type of filling and the presence of any adverse health conditions. Do fillings that contain mercury appear to affect health conditions?
Expert Solution & Answer
Want to see the full answer?
Check out a sample textbook solution
Students have asked these similar questions
The table below refers to a case control study on the association between sulfones and streptomycin drugs in the treatment of leprosy. Subjects were sampled based on their clinical change to treatment and then asked whether they had a high or low degree of infiltration. The degree of infiltration measures a type of skin damage. We will use clinical change response scores {-1, 0, 1, 2, 3}. The question of interest is whether degree of infiltration is associated with clinical change.
(a) Compute the sample proportions of having a high degree of infiltration for each clinical change group? What type of variable is Clinical Change?
(B)Conduct a Cochran-Armitage trend test at the 5% significance level to determine whether there is an association between degree of infiltration and clinical change.
(C)Now, ignore the fact that clinical change is an ordinal variable. Conduct a chi-squared test for association between degree of infiltration and clinical change at the 5% significance…
Smoking, Gender, and Body Temperature The table below lists body temperatures obtained from randomly selected subjects (based on Data Set 3 “Body Temperatures” in Appendix B). Using a 0.05 significance level, test for an interaction between gender and smoking, test for an effect from gender, and test for an effect from smoking. What do you conclude?
Texting while driving: The accident rate for students who didn’t text while using a driving simulator was 7%. In a driver distraction study of 1,876 randomly selected students, the accident rate for students who texted while driving was higher than 7%. This difference was statistically significant at the 0.05 level.
Which of the following best describes how we should interpret these results?
Because of the large size of the sample, these results are strong evidence that texting accounts for a much larger proportion of accidents in the population of student drivers.
With a large sample, statistically significant results suggest a large increase in the accident rate for the texting group over the control group.
With a large sample, statistically significant results may actually be only a small improvement over the control group (depending on the size of the increase in percentages).
Regardless of the sample size, a statistically significant result means there is a meaningful…
Chapter 11 Solutions
Essentials of Statistics (6th Edition)
Ch. 11.1 - Cybersecurity The table below lists leading digits...Ch. 11.1 - 2. Cybersecurity When using the data from Exercise...Ch. 11.1 - Cybersecurity The accompanying Statdisk results...Ch. 11.1 - Cybersecurity What do the results from the...Ch. 11.1 - In Exercises 520, conduct the hypothesis test and...Ch. 11.1 - In Exercises 520, conduct the hypothesis test and...Ch. 11.1 - In Exercises 520, conduct the hypothesis test and...Ch. 11.1 - In Exercises 520, conduct the hypothesis test and...Ch. 11.1 - In Exercises 520, conduct the hypothesis test and...Ch. 11.1 - In Exercises 520, conduct the hypothesis test and...
Ch. 11.1 - In Exercises 520, conduct the hypothesis test and...Ch. 11.1 - In Exercises 520, conduct the hypothesis test and...Ch. 11.1 - In Exercises 520, conduct the hypothesis test and...Ch. 11.1 - In Exercises 520, conduct the hypothesis test and...Ch. 11.1 - In Exercises 520, conduct the hypothesis test and...Ch. 11.1 - In Exercises 520, conduct the hypothesis test and...Ch. 11.1 - Ben fords Law. According to Benfords law, a...Ch. 11.1 - Ben fords Law. According to Benfords law, a...Ch. 11.1 - Ben fords Law. According to Benfords law, a...Ch. 11.1 - Ben fords Law. According to Benfords law, a...Ch. 11.1 - Assumed mid-point x=fxn=39825180=221.25...Ch. 11.2 - Handedness and Cell Phone Use The accompanying...Ch. 11.2 - Ear Preference for Cell Phone Use 2. Hypotheses...Ch. 11.2 - Hypothesis Test The accompanying TI-83/84 Plus...Ch. 11.2 - Right-Tailed, Left-Tailed, Two-Tailed Is the...Ch. 11.2 - Prob. 5BSCCh. 11.2 - In Exercises 5-18, test the given claim. 6. Splint...Ch. 11.2 - In Exercises 5-18, test the given claim. 7....Ch. 11.2 - Prob. 8BSCCh. 11.2 - In Exercises 5-18, test the given claim. 9. Four...Ch. 11.2 - In Exercises 5-18, test the given claim. 10....Ch. 11.2 - In Exercises 5-18, test the given claim. 11....Ch. 11.2 - In Exercises 5-18, test the given claim. 12. Nurse...Ch. 11.2 - Soccer Strategy In soccer, serious fouls in the...Ch. 11.2 - In Exercises 5-18, lest the given claim. 14. Is...Ch. 11.2 - In Exercises 518, test the given claim. 15....Ch. 11.2 - In Exercises 5-18, test the given claim. 16....Ch. 11.2 - Prob. 17BSCCh. 11.2 - In Exercises 5-18, test the given claim. 18....Ch. 11.2 - In Exercises 5-18, lest the given claim. 19. Car...Ch. 11.2 - Is the Home Field Advantage Independent of the...Ch. 11.2 - Equivalent Tests A X2 test involving a 2 2 table...Ch. 11.2 - Using Yatess Correction for Continuity The...Ch. 11.3 - In Exercises 1-4, use the following listed arrival...Ch. 11.3 - In Exercises 1-4, use the following listed arrival...Ch. 11.3 - In Exercises 1-4, use the following listed arrival...Ch. 11.3 - In Exercises 1-4, use the following listed arrival...Ch. 11.3 - In Exercises 5-16, use analysis of variance for...Ch. 11.3 - In Exercises 5-16, use analysis of variance for...Ch. 11.3 - In Exercises 5-16, use analysis of variance for...Ch. 11.3 - In Exercises 5-16, use analysis of variance for...Ch. 11.3 - In Exercises 5-16, use analysis of variance for...Ch. 11.3 - Prob. 10BSCCh. 11.3 - Triathlon Times Jeff Parent is a statistics...Ch. 11.3 - Arsenic in Rice Listed below are amounts of...Ch. 11.3 - Prob. 13BSCCh. 11.3 - Speed Dating Listed below are attribute ratings of...Ch. 11.3 - Tukey Test A display of the Bonferroni test...Ch. 11.3 - Two-Way ANOVA The pulse rates in Table 12-3 from...Ch. 11 - Exercises 1-5 refer to the sample data in the...Ch. 11 - Exercises 15 refer to the sample data in the...Ch. 11 - Exercises 15 refer to the sample data in the...Ch. 11 - Prob. 4CQQCh. 11 - Exercises 15 refer to the sample data in the...Ch. 11 - Questions 610 refer to the sample data in the...Ch. 11 - Questions 610 refer to the sample data in the...Ch. 11 - Questions 6-10 refer to the sample data in the...Ch. 11 - Questions 6-10 refer to the sample data in the...Ch. 11 - Motor Vehicle Fatalities The table below lists...Ch. 11 - Tooth Fillings The table below shows results from...Ch. 11 - American Idol Contestants on the TV show American...Ch. 11 - Clinical Trial of Lipitor Lipitor is the trade...Ch. 11 - Weather-Related Deaths For a recent year, the...Ch. 11 - Weather-Related Deaths Review Exercise 5 involved...Ch. 11 - Chocolate and Happiness In a survey sponsored by...Ch. 11 - Chocolate and Happiness Use the results from part...Ch. 11 - Chocolate and Happiness Use the results from part...Ch. 11 - One Big Bill or Many Smaller Bills In a study of...Ch. 11 - 6. Probability Refer to the results from the 150...Ch. 11 - Car Repair Costs Listed below are repair costs (in...Ch. 11 - Forward Grip Reach and Ergonomics When designing...Ch. 11 - Use Statdisk, Minitab, Excel, StatCrunch, a...Ch. 11 - FROM DATA TO DECISION Critical Thinking: Was...Ch. 11 - Cola Weights Data Set 26 Cola Weights and Volumes...Ch. 11 - Speed Dating Data Set 18 Speed Dating in Appendix...Ch. 11 - Author Readability Pages were randomly selected by...
Knowledge Booster


Learn more about
Need a deep-dive on the concept behind this application? Look no further. Learn more about this topic, statistics and related others by exploring similar questions and additional content below.Similar questions
- What is meant by the sample space of an experiment?arrow_forwardWhat is an experiment?arrow_forwardCalcium and Blood Pressure: Sample data were collected in a study of calcium supplements and their effects on blood pressure. A placebo group and a calcium group began the study with blood pressure measurements (based on data from “Blood Pressure and Metabolic Effects of Calcium Supplementation in Normotensive White and Black Men,” by Lyle et al., Journal of the American Medical Association, Vol. 257, No. 13). Sample values are listed below. At the 0.05 significance level, test the claim that the two sample groups come from population with the same standard deviation. Placebo: 124.6 104.8 96.5 116.3 106.1 128.8 107.2 123.1 118.1 108.5 120.4 122.5 113.6 Calcium: 129.1 123.4 102.7 118.1 114.7 120.9 104.4 116.3 109.6 127.7 108.0 124.3 106.6 121.4 113.2…arrow_forward
- Calcium and Blood Pressure Does increasing the amount of calcium in our diet reduce blood pressure? Examination of a large sample of people revealed a relationship between calcium intake and blood pressure. Such observational studies do not establish causation. Researchers therefore designed a randomized comparative experiment. The subjects were 21 healthy men who volunteered to take part in the experiment. They were randomly assigned to two groups: 10 of the men received a calcium supplement for 12 weeks, while the control group of 11 men received a placebo pill that looked identical. The experiment was double-blind. The response variable is the decrease in systolic (top number) blood pressure for a subject after 12 weeks, in millimeters of mercury. An increase appears as a negative number. Do the data provide convincing evidence that a calcium supplement reduces blood pressure more than a placebo, on average, for subjects like the ones in this study? Group 1 (calcium) Group (placebo)…arrow_forwardBlanking Out on Tests In a study of students blanking out on tests, the arrangement of test items was studied for its effect on anxiety. The following scores are measures of “debilitating test anxiety” (based on data from “Item Arrangement, Cognitive Entry Characteristics, Sex and Test Anxiety as Predictors of Achievement in Examination Performance,” by Klimko, Journal of Experimental Education, Vol. 52, No. 4.) Is there sufficient evidence to support the claim that the two samples are from populations with different medians? Is there sufficient evidence to support the claim that the arrangement of the test items has an effect on the score? Use a 0.01 significance level.arrow_forwardThe table below summarizes results for randomly selected drivers stopped by police in a recent year. Using technology, the data in the table results in the statistics that follow. chi-square statistic=1.737, degrees of freedom=1, P-value=0.188 Use a 0.05 significance level to test the claim that being stopped is independent of race. Based on available evidence, can we conclude that racial profiling is being used? Can we conclude that racial profiling is being used?arrow_forward
- A study used x-ray computed tomography (CT) to collect data on brain volumes for a group of patients with obsessive-compulsive disorders and a control group of healthy persons. Sample results (in mL) are given below for total brain volumes. Use a 0.05 significance level to test the claim that there is no difference between the mean for obsessive-compulsive patients and the mean for healthy persons. Obsessive-compulsive patients: n = 10, x overbar equals 1390.03 , s = 156.84 Control group: n = 10, x overbar equals 1275.94 , s = 137.97 a. Define the parameters A. mu 1 equals The mean brain volume of all obsessive-compulsive people mu 2 equals The mean brain volume of all healthy persons B. mu 1 equals The mean test score of all obsessive-compulsive people mu 2 equals The mean test score of all healthy persons C. mu 1 equals The mean brain volume of 10 obsessive-compulsive…arrow_forwardresearcher notes that there seems to be a difference in the prevalence of high cholesterol among individuals who smoke and consume diets high in processed food and the prevalence of high cholesterol among individuals who do not smoke and do not consume diets high in processed foods. Use the appropriate hypothesis to test for independence of two independent variables presented here at the 5% significance level to ensure confounding has not influenced the study's results. Then interpret your response. A. The chi square value of 37.724 is higher than the chi square value of 3.84, therefore we can accept H0 at the 5% level and reject H1, which states that smoking status and the incidence of high cholesterol are not independent of one another B. The chi square value of 37.724 is higher than the chi square value of 3.84, therefore we can reject H0 at the 5% level in favor of H1, which states that smoking status and the incidence of high cholesterol are not independent of one…arrow_forwardIs Seat Belt Use Independent of Cigarette Smoking?A study of seat belt users and nonusers yielded the randomly selected sample data summarized in the given table (based on data from “What Kinds of People Do Not Use Seat Belts?” by Helsing and Comstock,American Journal of Public Health,Vol. 67, No. 11). Test the claim that the amount of smoking is independent of seat belt use. A plausible theory is that people who smoke more are less concerned about their health and safety and are therefore less inclined to wear seat belts. Is this theory supported by the sample data?arrow_forward
- Worker Fatigue. A study by M. Chen et al. titled “Heat Stress Evaluation andWorker Fatigue in a Steel Plant” (American Industrial Hygiene Association, Vol. 64, pp. 352–359) assessed fatigue in steelplant workers due to heat stress. Among other things, the researchers monitored the heart rates of a random sample of 29 casting workers. A hypothesis test is to be conducted to decide whether the mean postwork heart rate of casting workers exceeds the normal resting heart rate of 72 beats per minute (bpm). a. determine the null hypothesis. b. determine the alternative hypothesis. c. classify the hypothesis test as two tailed, left tailed, or right tailed.arrow_forwardPassive exposure to environmental tobacco smoke has been associated with growth suppression and an increased frequency of respiratory tract infections in normal children. Is this association more pronounced in children with cystic fibrosis? To answer this question, 43 children (18 girls and 25 boys) attending a 2-week summer camp for cystic fibrosis patients were studied (New England Journal of Medicine, Sept. 20, 1990). Among several variables measured were the child's weight percentile (y) and the number of cigarettes smoked per day in the child's home (x). a. For the 18 girls, the coefficient of correlation between y and x was reported as r = –.50. Interpret - this result. b. Refer to part a. The p-value for testing Ho: p = 0 against H;: p # 0 was reported as p = .03. n Interpret this result. c. For the 25 boys, the coefficient of correlation between y and x was reported asr = -.12. Interpret %3D %3D this result. d. Refer to part c. The p-value for testing Ho: p = 0 against Ha: p #…arrow_forwardProfessor Evaluation Scores Listed below are student evaluation scores of female professors and male professors from Data Set 17 “Course Evaluations” in Appendix B. Use a 0.05 significance level to test the claim that female professors and male professors have evaluation scores with the same variation.arrow_forward
arrow_back_ios
arrow_forward_ios
Recommended textbooks for you
 Big Ideas Math A Bridge To Success Algebra 1: Stu...AlgebraISBN:9781680331141Author:HOUGHTON MIFFLIN HARCOURTPublisher:Houghton Mifflin Harcourt
 Glencoe Algebra 1, Student Edition, 9780079039897...AlgebraISBN:9780079039897Author:CarterPublisher:McGraw Hill
 College Algebra (MindTap Course List)AlgebraISBN:9781305652231Author:R. David Gustafson, Jeff HughesPublisher:Cengage Learning
Big Ideas Math A Bridge To Success Algebra 1: Stu...
Algebra
ISBN:9781680331141
Author:HOUGHTON MIFFLIN HARCOURT
Publisher:Houghton Mifflin Harcourt
Glencoe Algebra 1, Student Edition, 9780079039897...
Algebra
ISBN:9780079039897
Author:Carter
Publisher:McGraw Hill
College Algebra (MindTap Course List)
Algebra
ISBN:9781305652231
Author:R. David Gustafson, Jeff Hughes
Publisher:Cengage Learning
Hypothesis Testing using Confidence Interval Approach; Author: BUM2413 Applied Statistics UMP;https://www.youtube.com/watch?v=Hq1l3e9pLyY;License: Standard YouTube License, CC-BY
Hypothesis Testing - Difference of Two Means - Student's -Distribution & Normal Distribution; Author: The Organic Chemistry Tutor;https://www.youtube.com/watch?v=UcZwyzwWU7o;License: Standard Youtube License