
Concept explainers
Videos
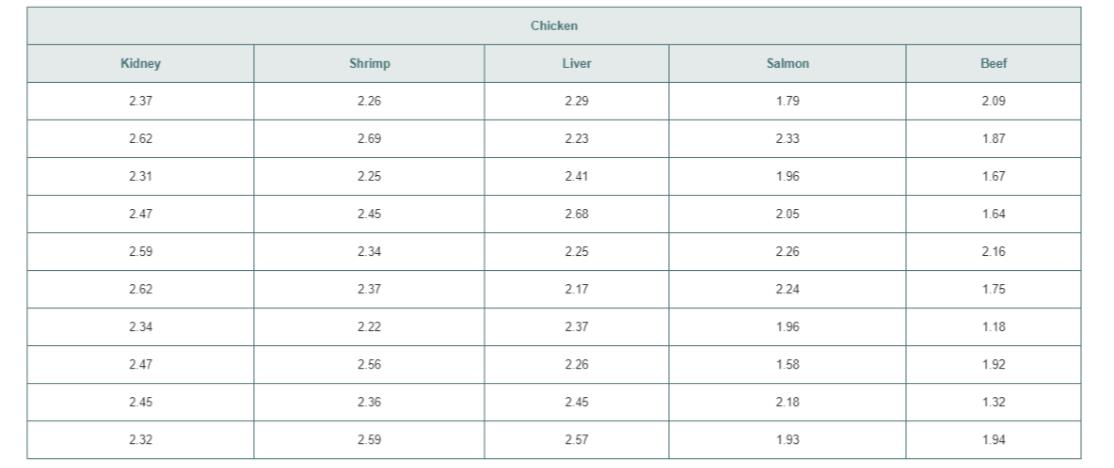
A pet food company has a business objective of expending its product line beyond its current kidney and shrimp-based cat foods. The company developed two new products, one based on chicken liver and the other based on salmon. The company conducted an experiment to compare the two new products with its two existing ones, as well as a generic beef-based product sold at a supermarket chain.
For the experiment, a sample of 50 cats from the population at a local animal shelter was selected. Ten cats were randomly assigned to each of the five products being tested. Each of the cats was then presented with 3 ounces of the selected food in a dish at feeding time. The researchers defined the variable to be measured as the number of ounces of food that the cat consumed within a 10-minute time interval that began when the filled dish was presented. The results for this experiment are summarized in the table on page 414 and stored in CatFood.
a. At the 0.05 of significance, is there evidence of a difference in the mean amount of food eaten among the various products?
b. If appropriate, determine which products appear to differ significantly in the mean amount of food eaten.
c. At the 0.05 level of significance, is there evidence of a difference in the variation in the amount of food eaten.
d. What should the pet food company conclude? Fully describe the pet food company’s options with respect to the products.
Want to see the full answer?
Check out a sample textbook solution
Chapter 11 Solutions
Basic Business Statistics Student Value Edition Plus NEW MyLab Statistics with Pearson eText -- Access Card Package (13th Edition)


- A company wishes to evaluate the effect of package design on one of its products, a certain brand of cereal. The four package designs are to be tested in different stores throughout a large city. There are 20 stores available for the study. The amount of cereal sold is known to vary depending on the size of the stores. The 20 stores are divided into five groups of four stores each by size. The following sales figures ($1000s) were obtained after a 1-month period. Stores Design A Design B Design C Design D 1 40 33 37 38 2 45 27 32 40 3 43 31 30 41 4 44 38 40 42 5 56 45 49 42 Enter the above data into a suitable software and then conduct an analysis of variance without blocking to test whether there is evidence of a significant difference in mean sales of different package designs. Use alpha=0.01. What is the conclusion for the null hypothesis that all treatment means are equal? O Do not reject HO. There is sufficient evidence to conclude that the average sales for all stores are not…arrow_forwardA company wishes to evaluate the effect of package design on one of its products, a certain brand of cereal. The four package designs are to be tested in different stores throughout a large city. There are 20 stores available for the study. The amount of cereal sold is known to vary depending on the size of the stores. The 20 stores are divided into five groups of four stores each by size. The following sales figures ($1000s) were obtained after a 1-month period. Stores Design A Design B Design C Design D 1 40 33 37 38 2 45 27 32 40 3 43 31 30 41 4 44 38 40 42 5 56 45 49 42 Enter the above data into a suitable software and then conduct an analysis of variance without blocking to test whether there is evidence of a significant difference in mean sales of different package designs. Use alpha = 0.01. the p-value associated with the observed test statistic? Please provide your answer to the nearest fou decimal places.arrow_forwardA company wishes to evaluate the effect of package design on one of its products, a certain brand of cereal. The four package designs are to be tested in different stores throughout a large city. There are 20 stores available for the study. The amount of cereal sold is known to vary depending on the size of the stores. The 20 stores are divided into five groups of four stores each by size. The following sales figures ($1000s) were obtained after a 1-month period. Stores Design A Design B Design C Design D 1 40 33 37 38 2 45 27 32 40 3 43 31 30 41 4 44 38 40 42 5 56 45 49 42 Enter the above data into a suitable software and then conduct an analysis of variance with blocking (analyze this data as a complete block design) to test further whether there is evidence of a significant difference in mean sales of different package designs. Use alpha = 0.01. What are the degrees of freedom for error?arrow_forward
- A company wishes to evaluate the effect of package design on one of its products, a certain brand of cereal. The four package designs are to be tested in different stores throughout a large city. There are 20 stores available for the study. The amount of cereal sold is known to vary depending on the size of the stores. The 20 stores are divided into five groups of four stores each by size. The following sales figures ($1000s) were obtained after a 1-month period. Stores Design A Design B Design C Design D 1 40 33 37 38 2 45 27 32 40 3 43 31 30 41 4 44 38 40 42 5 56 45 49 42 Enter the above data into a suitable software and then conduct an analysis of variance with blocking (analyze this data as a complete block design) to test further whether there is evidence of a significant difference in mean sales of different package designs. Use alpha = 0.01. What are the mean squares for Treatments? Provide your answer to the nearest 2 decimal places.arrow_forwardA pharmaceutical company is testing the effectiveness of its vaccine across two different age brackets. They take a sample and split the participants up into two separate groups. Group A consists of 44 people who are between ages 13 and 18. Group B consists of 58 people between ages 19 and 26. After being administered the vaccine, it was found that 37 people from group A were immune to the virus and 42 people from group B were immune. What proportion of people from Group A were immune? What proportion of people from Group B were immune? What proportion of people in this study were immune?arrow_forwardA phamaceutical company wants to test the effectiveness of a new allergy drug. The company identifies 250 females 30-35 years old who suffer from severe allergies. The subjects are randomly assigned into two groups. One group is given the new allergy drug and the other is given a placebo that looks exactly like the new allergy drug. After six months, the subjects' symptoms are studied and compared. Answer parts (a) through (c) below. O B. The experimental units are the symptoms from the drug. The treatment is the new allergy drug. O C. The experimental unit is the new allergy drug. The treatments are the severe allergies the patients suffer from. O D. The experimental units are the 30- to 35-year-old females being given the treatment. The treatment is the new allergy drug. (b) Identify a potential problem with the experiment design being used and suggest a way to improve it. Choose the correct answer below. O A. There may be a bias on the part of the patients since they do not know if…arrow_forward
- A school psychologist wants to test the effectiveness of a new method of teaching biologybiology. She recruits 500500 firstfirst-grade students and randomly divides them into two groups. Group 1 is taught by means of the new method, while group 2 is taught by traditional methods. The same teacher is assigned to teach both groups. At the end of the year, an achievement test (graded on a scale from 1-10) is administered and the results of the two groups are compared. Complete parts (a) through (i) below.(a) What is the response variable in this experiment? A.The scores on the achievement tests of both group 1 and group 2 B.The students' ability in biologybiology C.The score of group 1 on the achievement test D.The score of group 2 on the achievement test (b) Is the response variable qualitative or quantitative? A.The response variable is quantitative because it is a measurement. B.The response variable is quantitative because it is a characteristic. C.The response variable is…arrow_forwardIn the twentieth century, it was a common practice in Southern California for houses to be built with pools in the backyard. For new homes, however, that practice may be changing, possibly as a measure to help reduce climate change. A recent study examined a random sample of 140 houses built in Southern California in the twentieth century and an independent, random sample of 81 new houses built in Southern California. The sample of twentieth century houses contained 61 houses with pools, and the sample of new houses contained 24 houses with pools.Based on this survey, can we conclude, at the 0.05 level of significance, that the proportion p1 of all Southern California twentieth century houses that were built with pools is greater than the proportion p2of all new Southern California houses that were built with pools?Perform a one-tailed test. Then complete the parts below. Carry your intermediate computations to three or more decimal places and round your answers as specified in the…arrow_forward(a) State the null hypothesis H and the alternative hypothesis H,. H, :0 On (b) Determine the type of test statistic to use. (Choose one) ▼ O=0 OSO (c) Find the value of the test statistic. (Round to three or more decimal places.) O#0 Oarrow_forwardarrow_back_iosSEE MORE QUESTIONSarrow_forward_ios
 Glencoe Algebra 1, Student Edition, 9780079039897...AlgebraISBN:9780079039897Author:CarterPublisher:McGraw Hill
 Holt Mcdougal Larson Pre-algebra: Student Edition...AlgebraISBN:9780547587776Author:HOLT MCDOUGALPublisher:HOLT MCDOUGAL
 College Algebra (MindTap Course List)AlgebraISBN:9781305652231Author:R. David Gustafson, Jeff HughesPublisher:Cengage Learning