
a)
Constant and increasing
a)
Explanation of Solution
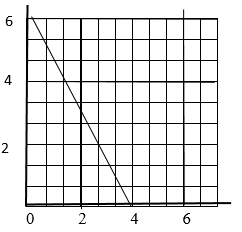
Labeled PPC graph for computers and cellphones that exhibits constant opportunity cost:
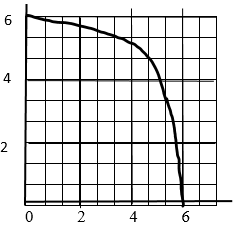
Labeled PPC graph for grapes and corns that exhibits increasing opportunity cost:
The straight line on PPC graph indicates constant opportunity cost that shows a situation where resources can be substituted for each other because these resources are not specialized. Without any added cost computers and cellphones can be substituted.
The second labeled PPC graph represents increasing opportunity cost through a bowed-out line which means for each additional unit of one commodity, the amount of another good has to be sacrificed. And, the quantity or amount of sacrificed good for each additional unit of another good is higher than the previous or old sacrificed unit.
Introduction: PPC or
b)
Direction of MC curve of cellphone.
b)
Explanation of Solution
MC curve for cellphone:
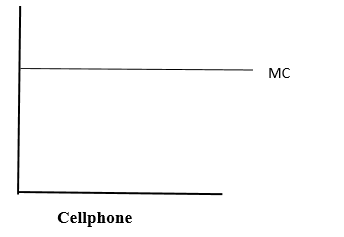
The marginal cost curve of Cellphone would be horizontal because its value is constant for every unit of good that is produced, no matter how many units are produced.
Introduction: Marginal cost is the expense or cost which is incurred by using an additional unit of a good to increase benefit.
c)
Direction of MC curve of corn.
c)
Explanation of Solution
MC curve for corn:
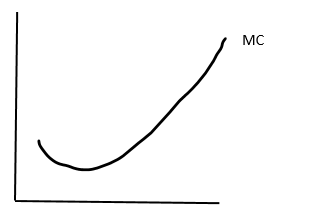
There would be upward-sloping marginal cost curve for the production of corn because more and more resources are required to supply or produce an addition unit of the good to increase the supply.
Introduction: Marginal cost is the expense or cost which is incurred by using an additional unit of a good to increase benefit.
d)
The total cost curve for the corn.
d)
Explanation of Solution
With the more production of corn, the total cost curve for corn would rise and it will rise at increasing rate.
Introduction: The total of fixed cost and variable cost presents total cost of producing a good.
e)
The direction of average fixed cost curve of corn.
e)
Explanation of Solution
As the fixed cost is not dependent on the quantity of production of corn as well as the fixed cost is not fixed, therefore, the average, fixed cost curve for the production of corn would be downward sloping.
Introduction: With the change in number of goods which are produced, the fixed cost would not change which is called average fixed cost.
Chapter 10R Solutions
Krugman's Economics For The Ap® Course


 Principles of Economics (12th Edition)EconomicsISBN:9780134078779Author:Karl E. Case, Ray C. Fair, Sharon E. OsterPublisher:PEARSON
 Engineering Economy (17th Edition)EconomicsISBN:9780134870069Author:William G. Sullivan, Elin M. Wicks, C. Patrick KoellingPublisher:PEARSON
 Principles of Economics (MindTap Course List)EconomicsISBN:9781305585126Author:N. Gregory MankiwPublisher:Cengage Learning
 Managerial Economics: A Problem Solving ApproachEconomicsISBN:9781337106665Author:Luke M. Froeb, Brian T. McCann, Michael R. Ward, Mike ShorPublisher:Cengage Learning
 Managerial Economics & Business Strategy (Mcgraw-...EconomicsISBN:9781259290619Author:Michael Baye, Jeff PrincePublisher:McGraw-Hill Education