
Mathematical Statistics with Applications
7th Edition
ISBN: 9780495110811
Author: Dennis Wackerly, William Mendenhall, Richard L. Scheaffer
Publisher: Cengage Learning
expand_more
expand_more
format_list_bulleted
Concept explainers
Videos
Textbook Question
Chapter 10.9, Problem 84E
An experiment published in The American Biology Teacher studied the efficacy of using 95% ethanol and 20% bleach as disinfectants for removing bacterial and fungal contamination when culturing plant tissues. The experiment was repeated 15 times with each disinfectant, using eggplant as the plant tissue cultured.17 Five cuttings per plant were placed on a petri dish, disinfected using each agent, and stored at 25°C for 4 weeks. The observations reported were the number of uncontaminated eggplant cuttings after the 4 weeks of storage. Relevant data is given in the following table. Are you willing to assume that the underlying population variances are equal?
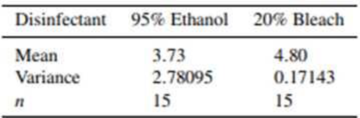
- a What can be said about the attained significance level using the F table in the appendix?
- b Applet Exercise What can be said about the attained significance level using the applet F-Ratio
Probabilities and Quantiles? - c What would you conclude, with α = .02?
Expert Solution & Answer

Trending nowThis is a popular solution!

Students have asked these similar questions
An engineer decides to test four plate materials at three temperature levels (15, 70, and 125°F).
Three batteries are tested at each combination of plate material and temperature. The experiment:
and the resulting observed battery life data (in hours) are given in the following table.
In an effort to link cold environments with hypertension in humans, a preliminary experiment was conducted to investigate the effect of cold on hypertension in rats. Two random samples of 6 rats each were exposed to different environments. One sample of rats was held in a normal environment at 26°C. The other sample was held in a cold 5°C environment. Blood pressures and heart rates were measured for rats for both groups. The blood pressures for the 12 rats are shown in the table below.
a. Provide a 95% confidence interval on the difference in the two population meansb. Do the data provide sufficient evidence that rats exposed to a 5°C environment have a higher mean blood pressure than rats exposed to a 26°C environment? Use α = 0.05
The concentration of carbon dioxide (CO2) in the atmosphere is increasing rapidly due to our use of fossil fuels. Because plants use CO2 to fuel photosynthesis,
more CO2 may cause trees and other plants to grow faster. An elaborate apparatus allows researchers to pipe extra CO2 to a 30-meter circle of forest. They
selected two nearby circles in each of three parts of a pine forest and randomly chose one of each pair to receive extra CO2. The response variable is the mean
increase in base area for 30 to 40 trees in a circle during a growing season. We measure this in percent increase per year. Here are one year's data.
Pair
Control plot
Treated plot
Treated - Control
9.782
10.647
0.865
2
7.283
9.254
1.971
3
5.712
8.695
2.983
(a) State the null and alternative hypotheses. (Where u is the mean difference, treated minus control.)
Но: и
На: и
? :
Explain clearly why the investigators used a one-sided alternative.
The researchers have no preconceived idea what extra CO2 will do to the growth…
Chapter 10 Solutions
Mathematical Statistics with Applications
Ch. 10.2 - Define and for a statistical test of hypotheses.Ch. 10.2 - An experimenter has prepared a drug dosage level...Ch. 10.2 - Refer to Exercise 10.2. a Find the rejection...Ch. 10.2 - Suppose that we wish to test the null hypothesis...Ch. 10.2 - Let Y1 and Y2 be independent and identically...Ch. 10.2 - We are interested in testing whether or not a coin...Ch. 10.2 - True or False Refer to Exercise 10.6. a The level...Ch. 10.2 - A two-stage clinical trial is planned for testing...Ch. 10.3 - A survey published in the American Journal of...Ch. 10.3 - The hourly wages in a particular industry are...
Ch. 10.3 - The output voltage for an electric circuit is...Ch. 10.3 - The Rockwell hardness index for steel is...Ch. 10.3 - Shear strength measurements derived from...Ch. 10.3 - Prob. 22ECh. 10.3 - Studies of the habits of white-tailed deer...Ch. 10.3 - A study by Childrens Hospital in Boston indicates...Ch. 10.3 - An article in American Demographics reports that...Ch. 10.3 - According to the Washington Post, nearly 45% of...Ch. 10.3 - The state of California is working very hard to...Ch. 10.3 - Prob. 28ECh. 10.3 - Prob. 29ECh. 10.3 - Prob. 30ECh. 10.3 - Prob. 31ECh. 10.3 - In March 2001, a Gallup poll asked. How would you...Ch. 10.3 - A political researcher believes that the fraction...Ch. 10.3 - Exercise 8.58 stated that a random sample of 500...Ch. 10.3 - Michael Sosin investigated determinants that...Ch. 10.3 - Prob. 36ECh. 10.4 - Refer to Exercise 10.19. If the voltage falls as...Ch. 10.4 - Refer to Exercise 10.20. The steel is sufficiently...Ch. 10.4 - Refer to Exercise 10.30. Calculate the value of ...Ch. 10.4 - Refer to Exercise 10.33. The political researcher...Ch. 10.4 - Refer to Exercise 10.34. Using the rejection...Ch. 10.4 - In Exercises 10.34 and 10.41, how large should the...Ch. 10.4 - A random sample of 37 second graders who...Ch. 10.4 - Refer to Exercise 10.43. Find the sample sizes...Ch. 10.5 - Refer to Exercise 10.21. Construct a 99%...Ch. 10.5 - Prob. 46ECh. 10.5 - Prob. 47ECh. 10.5 - Prob. 48ECh. 10.5 - Prob. 49ECh. 10.6 - High airline occupancy rates on scheduled flights...Ch. 10.6 - Two sets of elementary schoolchildren were taught...Ch. 10.6 - A biologist has hypothesized that high...Ch. 10.6 - How would you like to live to be 200 years old?...Ch. 10.6 - Do you believe that an exceptionally high...Ch. 10.6 - A check-cashing service found that approximately...Ch. 10.6 - Prob. 56ECh. 10.6 - Prob. 57ECh. 10.6 - Prob. 58ECh. 10.8 - Why is the Z test usually inappropriate as a test...Ch. 10.8 - Prob. 62ECh. 10.8 - A chemical process has produced, on the average,...Ch. 10.8 - A coin-operated soft-drink machine was designed to...Ch. 10.8 - Operators of gasoline-fueled vehicles complain...Ch. 10.8 - Researchers have shown that cigarette smoking has...Ch. 10.8 - Nutritional information provided by Kentucky Fried...Ch. 10.8 - Prob. 68ECh. 10.8 - Two methods for teaching reading were applied to...Ch. 10.8 - A study was conducted by the Florida Game and Fish...Ch. 10.8 - Under normal conditions, is the average body...Ch. 10.8 - Prob. 72ECh. 10.8 - In Exercise 8.83, we presented some data collected...Ch. 10.8 - Prob. 74ECh. 10.8 - Prob. 75ECh. 10.8 - Prob. 76ECh. 10.8 - Prob. 77ECh. 10.9 - A manufacturer of hard safety hats for...Ch. 10.9 - Prob. 79ECh. 10.9 - Prob. 80ECh. 10.9 - Prob. 81ECh. 10.9 - Exercises 8.83 and 10.73 presented some data...Ch. 10.9 - Prob. 83ECh. 10.9 - An experiment published in The American Biology...Ch. 10.9 - Prob. 85ECh. 10.9 - Aptitude tests should produce scores with a large...Ch. 10.9 - Prob. 87ECh. 10.10 - Refer to Exercise 10.2. Find the power of the test...Ch. 10.10 - Prob. 89ECh. 10.10 - Refer to Exercise 10.5. a Find the power of test 2...Ch. 10.10 - Let Y1, Y2,, Y20 be a random sample of size n = 20...Ch. 10.10 - Consider the situation described in Exercise...Ch. 10.10 - For a normal distribution with mean and variance...Ch. 10.10 - Suppose that Y1, Y2, ,Yn constitute a random...Ch. 10.10 - Prob. 95ECh. 10.10 - Prob. 96ECh. 10.10 - Prob. 97ECh. 10.10 - Prob. 98ECh. 10.10 - Prob. 99ECh. 10.10 - Prob. 100ECh. 10.10 - Prob. 101ECh. 10.10 - Prob. 102ECh. 10.10 - Prob. 103ECh. 10.10 - Refer to the random sample of Exercise 10.103. a...Ch. 10.11 - Let Y1, Y2,, Yn denote a random sample from a...Ch. 10.11 - A survey of voter sentiment was conducted in four...Ch. 10.11 - Prob. 107ECh. 10.11 - Prob. 108ECh. 10.11 - Let X1, X2,, Xm denote a random sample from the...Ch. 10.11 - Show that a likelihood ratio test depends on the...Ch. 10.11 - Suppose that we are interested in testing the...Ch. 10.11 - Prob. 112ECh. 10.11 - Refer to Exercise 10.112. Show that in testing of...Ch. 10.11 - Prob. 114ECh. 10 - True or False. a If the p-value for a test is...Ch. 10 - Prob. 116SECh. 10 - Prob. 117SECh. 10 - Prob. 118SECh. 10 - Prob. 119SECh. 10 - Prob. 120SECh. 10 - Prob. 121SECh. 10 - Prob. 122SECh. 10 - A pharmaceutical manufacturer purchases a...Ch. 10 - Prob. 124SECh. 10 - Prob. 125SECh. 10 - Prob. 126SECh. 10 - Prob. 127SECh. 10 - Prob. 128SECh. 10 - Prob. 129SECh. 10 - Prob. 130SE
Knowledge Booster


Learn more about
Need a deep-dive on the concept behind this application? Look no further. Learn more about this topic, statistics and related others by exploring similar questions and additional content below.Similar questions
- In the experiment, a group of college students was told that they were participating in a manual dexterity study. Half of the students were given a stack of money to count and the other half got a stack of blank pieces of paper. After the counting task, the participants were asked to dip their hands into bowls of very hot water (122°F) and rate how uncomfortable it was. The following data show ratings of pain similar to the results obtained in the study. A. State null and alternative hypotheses b. Report results of statistical test, i.e., significant or not? Use .05 2-tailed alpha level. (what error might you be making) c. Report Cohen’s d value and interpretarrow_forwardThe height ( in inches) of a plant x months after an experiment begins is given byarrow_forwardThe concentration of carbon dioxide (COy) in the atmosphere is increasing rapidly due to our use of fossil fuels. Because plants use COz to fuel photosynthesis, more COz may cause trees and other plants to grow faster. An elaborate apparatus allows researchers to pipe extra CO, to a 30-meter circle of forest. They selected two nearby circles in each of three parts of a pine forest and randomly chose one of each pair to receive extra COz. The response variable is the mean increase in base area for 30 to 40 trees in a circle during a growing season. We measure this in percentage increase per year. Here are one year's data Pair 1 2 3 Control Plot 9.752 7.263 5.742 Treated Plot 10.587 9.244 8.675 Treated - Control 0.835 1.981 2.933 State the null and alternative hypotheses. Explain clearly why the investigators used a onesided alternative. Use at procedure to carry out a test and report your conclusion in simple language. The investigators used the test you just carried out.Any use of the…arrow_forward
- An experiment was conducted to study the extrusion process of biodegradable packaging foam. Two of the factors considered for their effect on the foam diameter (mm) were the die temperature(145°C vs.155°C) and the die diameter (3 mm vs. 4 mm). The results are in the accompanying data table. The question are attached in a photoarrow_forwardThe concentration of carbon dioxide (CO2) in the atmosphere is increasing rapidly due to our use of fossil fuels. Because plants use CO2 to fuel photosynthesis, more CO, may cause trees and other plants to grow faster. An elaborate apparatus allows researchers to pipe extra CO, to a 30-meter circle of forest. They selected two nearby circles in each of three parts of a pine forest and randomly chose one of each pair to receive extra CO,. The response variable is the mean increase in base area for 30 to 40 trees in a circle during a growing season. We measure this in percent increase per year. Here are one year's data. Control plot - Control Treated plot 10.547 Pair Treated 9.732 0.815 7.273 9.244 1.971 5.762 8.675 2.913 (a) State the null and alternative hypotheses. (Where u is the mean difference, treated minus control.) Но: и На: и Explain clearly why the investigators used a one-sided alternative. The researchers have no preconceived idea what extra CO, will do to the growth rate.…arrow_forwardIn an experiment, a group of college students was told that they were participating in a manual skill study. Half of the students were given a stack of money to count and the other half got a stack of blank pieces of paper. After the counting task, the participants were asked to dip their hands into bowls of very hot water (122°F) and rate how uncomfortable it was. Given the following data; Find the Test statistics for two independent samples. For counting Money: n1=10, M1=52, SS1=2300 For counting Paper: n2 =10, M2=60, SS2=2338 Please type the test statistics only in nearest hundredths place.arrow_forward
- n an experiment, a group of college students was told that they were participating in a manual skill study. Half of the students were given a stack of money to count and the other half got a stack of blank pieces of paper. After the counting task, the participants were asked to dip their hands into bowls of very hot water (122°F) and rate how uncomfortable it was. Given the following data; Find the Test statistics for two independent samples. For counting Money: n1=10, M1=54, SS1=2300 For counting Paper: n2 =10, M2=60, SS2=2355 Please type the test statistics only in nearest hundredths placearrow_forwardOne operation of a mill is to cut pieces of steel into parts that will later be used as the frame for front seats in an automobile. The steel is cut with a diamond saw and requires the resulting parts to be within 10.005 inch of the length specified by the automobile company. Data are collected from a sample of 50 steel parts and are shown in the following table. The measurement reported is the difference in inches between the actual length of the steel part, as measured by a laser measurement device, and the specified length of the steel part. For example, the first value, -0.003, represents a steel part that is 0.003 inch shorter than the specified length. Complete parts a through c Click the icon to view the data table. a. Construct a frequency distribution Difference in Length -0.005 but less than -0.003: -0.003but less than -0.001 -0.001but less than 0.001 0.001but less than 0.003 0.003but less than 0.005 Frequency Difference Between Actual and Specified Lengths 0.002 0 -0.003…arrow_forwardZhou and Vohs (2009) published a study showing that handling money reduces the perception of pain. In the experiment, a group of college students was told that they were participating in a manual dexterity study. Half of the students were given a stack of money to count and the other half got a stack of blank pieces of paper. After the counting task, the participants were asked to dip their hands into bowls of very hot water (122° F) and rate how uncomfortable it was. The following data show ratings of pain similar to the results obtained in the study. Counting Money Counting Paper 7 9 8 11 10 13 6 10 8 11 5 9 7 15 12 14 5 10 Convert the data from this problem into a form suitable for the point-biserial correlation (use Y = 1 for the money and 0 for the plain paper), and then compute the correlation. ∑X ∑Y ∑XY SSXX SSYY SP r Square the value of the point-biserial correlation to obtain r².…arrow_forward
- Murder was committed in an air-conditioned laboratory. Dr. Quincy, the medical examiner, was summoned to the scene of the crime. One of the first things he did was to take the temperature of the corpse. At 9:23 PM, he recorded the temperature to be 20.1oC and at 9:53 Pm to be 18.7oC. He further observed that the thermostat of the air-conditioning unit was set at 16oC. After gathering all pertinent data and analyzing them for sometime, he submitted a preliminary report stating that the victim was murdered between 7 PM and 8 PM. Was Dr. Quincy's report correct? At what approximate time did the victim die? Assume that the normal body temperature of a human being, alive and well, is 37oC.arrow_forwardPoisoning by the pesticide DDT causes tremors and convulsions. In a study of DDT poisoning, researchers fed several rats a measured amount of DDT. They then made measurements on the rats’ nervous systems that might explain how DDT poisoning causes tremors. One important variable was the “absolutely refractory period,” the time required for a nerve to recover after a stimulus. This period varies normally. Measurements on four rats gave the following measurements (in milliseconds): 6, 1.7, 1.8, 1.9. Estimate the mean absolutely refractory period for all rats of this strain when subjected to the same treatment.arrow_forwardThree different corrosion-resistant coatings are being considered for use on iron pipes. Ten pieces of pipe are marked off in six equal segments. For each pipe, two segments received coating A, two received coating B, and the remaining two received coating C. The pipes were placed in a corrosive environment for a period of time; then the depth of the deepest pit (in mm) caused by corrosion was measured for each segment on each pipe. The effect of interest is the coating; the pipe is a blocking factor, and there were two replications on each pipe. The following sums of squares were calculated: sum of squares for blocks = 11.2, sum of squares for treatments = 4.8, sum of squares for interactions = 18.4, total sum of squares = 44.7. a) Construct an ANOVA table. You may give ranges for the P-values. b) Are the assumptions for a randomized complete block design satisfied? Explain. c) Does the ANOVA table provide evidence that mean pit depth differs among coatings? Explain.arrow_forward
arrow_back_ios
SEE MORE QUESTIONS
arrow_forward_ios
Recommended textbooks for you
 MATLAB: An Introduction with ApplicationsStatisticsISBN:9781119256830Author:Amos GilatPublisher:John Wiley & Sons Inc
 Probability and Statistics for Engineering and th...StatisticsISBN:9781305251809Author:Jay L. DevorePublisher:Cengage Learning
 Statistics for The Behavioral Sciences (MindTap C...StatisticsISBN:9781305504912Author:Frederick J Gravetter, Larry B. WallnauPublisher:Cengage Learning
 Elementary Statistics: Picturing the World (7th E...StatisticsISBN:9780134683416Author:Ron Larson, Betsy FarberPublisher:PEARSON
 The Basic Practice of StatisticsStatisticsISBN:9781319042578Author:David S. Moore, William I. Notz, Michael A. FlignerPublisher:W. H. Freeman
 Introduction to the Practice of StatisticsStatisticsISBN:9781319013387Author:David S. Moore, George P. McCabe, Bruce A. CraigPublisher:W. H. Freeman
MATLAB: An Introduction with Applications
Statistics
ISBN:9781119256830
Author:Amos Gilat
Publisher:John Wiley & Sons Inc
Probability and Statistics for Engineering and th...
Statistics
ISBN:9781305251809
Author:Jay L. Devore
Publisher:Cengage Learning
Statistics for The Behavioral Sciences (MindTap C...
Statistics
ISBN:9781305504912
Author:Frederick J Gravetter, Larry B. Wallnau
Publisher:Cengage Learning
Elementary Statistics: Picturing the World (7th E...
Statistics
ISBN:9780134683416
Author:Ron Larson, Betsy Farber
Publisher:PEARSON
The Basic Practice of Statistics
Statistics
ISBN:9781319042578
Author:David S. Moore, William I. Notz, Michael A. Fligner
Publisher:W. H. Freeman
Introduction to the Practice of Statistics
Statistics
ISBN:9781319013387
Author:David S. Moore, George P. McCabe, Bruce A. Craig
Publisher:W. H. Freeman
Statistics 4.1 Point Estimators; Author: Dr. Jack L. Jackson II;https://www.youtube.com/watch?v=2MrI0J8XCEE;License: Standard YouTube License, CC-BY
Statistics 101: Point Estimators; Author: Brandon Foltz;https://www.youtube.com/watch?v=4v41z3HwLaM;License: Standard YouTube License, CC-BY
Central limit theorem; Author: 365 Data Science;https://www.youtube.com/watch?v=b5xQmk9veZ4;License: Standard YouTube License, CC-BY
Point Estimate Definition & Example; Author: Prof. Essa;https://www.youtube.com/watch?v=OTVwtvQmSn0;License: Standard Youtube License
Point Estimation; Author: Vamsidhar Ambatipudi;https://www.youtube.com/watch?v=flqhlM2bZWc;License: Standard Youtube License