
Mathematical Statistics with Applications
7th Edition
ISBN: 9780495110811
Author: Dennis Wackerly, William Mendenhall, Richard L. Scheaffer
Publisher: Cengage Learning
expand_more
expand_more
format_list_bulleted
Videos
Textbook Question
Chapter 10.3, Problem 21E
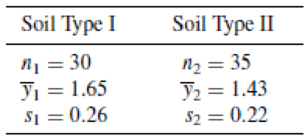
Shear strength measurements derived from unconfined compression tests for two types of soils gave the results shown in the following table (measurements in tons per square foot). Do the soils appear to differ with respect to average shear strength, at the 1% significance level?
Expert Solution & Answer

Trending nowThis is a popular solution!

Students have asked these similar questions
A study of the properties of metal plate-connected trusses used for roof support yielded the following observations on axial stiffness index (kips/in.) for plate lengths 4, 6, 8, 10, and 12 in:
4: 315.2 409.5 311.0 326.5 316.8 349.8 309.7
6: 405.1
347.2 361.0 404.5 331.0 348.9 381.7
8:
399.4 366.2 351.0 357.1
409.9 367.3
382.0
10: 353.7 452.9
461.4 433.1
410.6 384.2
362.6
12: 417.4
441.8 419.9 410.7
473.4 441.2
465.8
n USE SALT
Does variation in plate length have any effect on true average axial stiffness? State the relevant hypotheses using analysis of variance.
O Ho: H1# H2 # Hz# H4# H5
H: at least two µ's are equal
O Ho: H1 = H2 = H3= H4= H5
H: at least two u's are unequal
O Ho: H1 # H2 # Hz# H4# Hs
H: all five u's are equal
O Ho: H1 = H2 = Hz3 = H4= Hs
H: all five u,'s are unequal
Test the relevant hypotheses using analysis of variance with a = 0.01. Display your results in an ANOVA table. (Round your answers to two decimal places.)
Degrees of
freedom
Sum of
Squares
Mean
Source…
The table below shows the results from the specific gravity (S.G.) test performed in a soil laboratory including twenty samples of sand. Determine the Coefficient of Quartile Variation.
A study of the properties of metal plate-connected trusses used for roof support yielded the following observations on axial stiffness index (kips/in.) for plate lengths 4, 6, 8, 10, and 12 in:
4: 329.2 409.5 311.0 326.5 316.8 349.8 309.7
6: 425.1 347.2 361.0 404.5 331.0 348.9 381.7
8: 389.4 366.2 351.0 357.1 409.9 367.3 382.0
10: 341.7 452.9 461.4 433.1 410.6 384.2 362.6
12: 414.4 441.8 419.9 410.7 473.4 441.2 465.8
USE SALT
Does variation in plate length have any effect on true average axial stiffness? State the relevant hypotheses using analysis of variance.
O Ho: M₁ = H₂ = 13 = H4 = 1₂
H₂: all five μ's are unequal
O Ho: My H₂ H3 ‡ M4 # M5
H₂: at least two μ's are equal
O Ho: My # H₂ H3 # H4 # H5
H₂: all five us are equal
=
=
o Hỏi khi là không = 3 = Mà khô
H₂: at least two μ's are unequal
Test the relevant hypotheses using analysis of variance with a = 0.01. Display your results in an ANOVA table. (Round your answers to two decimal places.)
Sum of
Squares
Source
Treatments
Error…
Chapter 10 Solutions
Mathematical Statistics with Applications
Ch. 10.2 - Define and for a statistical test of hypotheses.Ch. 10.2 - An experimenter has prepared a drug dosage level...Ch. 10.2 - Refer to Exercise 10.2. a Find the rejection...Ch. 10.2 - Suppose that we wish to test the null hypothesis...Ch. 10.2 - Let Y1 and Y2 be independent and identically...Ch. 10.2 - We are interested in testing whether or not a coin...Ch. 10.2 - True or False Refer to Exercise 10.6. a The level...Ch. 10.2 - A two-stage clinical trial is planned for testing...Ch. 10.3 - A survey published in the American Journal of...Ch. 10.3 - The hourly wages in a particular industry are...
Ch. 10.3 - The output voltage for an electric circuit is...Ch. 10.3 - The Rockwell hardness index for steel is...Ch. 10.3 - Shear strength measurements derived from...Ch. 10.3 - Prob. 22ECh. 10.3 - Studies of the habits of white-tailed deer...Ch. 10.3 - A study by Childrens Hospital in Boston indicates...Ch. 10.3 - An article in American Demographics reports that...Ch. 10.3 - According to the Washington Post, nearly 45% of...Ch. 10.3 - The state of California is working very hard to...Ch. 10.3 - Prob. 28ECh. 10.3 - Prob. 29ECh. 10.3 - Prob. 30ECh. 10.3 - Prob. 31ECh. 10.3 - In March 2001, a Gallup poll asked. How would you...Ch. 10.3 - A political researcher believes that the fraction...Ch. 10.3 - Exercise 8.58 stated that a random sample of 500...Ch. 10.3 - Michael Sosin investigated determinants that...Ch. 10.3 - Prob. 36ECh. 10.4 - Refer to Exercise 10.19. If the voltage falls as...Ch. 10.4 - Refer to Exercise 10.20. The steel is sufficiently...Ch. 10.4 - Refer to Exercise 10.30. Calculate the value of ...Ch. 10.4 - Refer to Exercise 10.33. The political researcher...Ch. 10.4 - Refer to Exercise 10.34. Using the rejection...Ch. 10.4 - In Exercises 10.34 and 10.41, how large should the...Ch. 10.4 - A random sample of 37 second graders who...Ch. 10.4 - Refer to Exercise 10.43. Find the sample sizes...Ch. 10.5 - Refer to Exercise 10.21. Construct a 99%...Ch. 10.5 - Prob. 46ECh. 10.5 - Prob. 47ECh. 10.5 - Prob. 48ECh. 10.5 - Prob. 49ECh. 10.6 - High airline occupancy rates on scheduled flights...Ch. 10.6 - Two sets of elementary schoolchildren were taught...Ch. 10.6 - A biologist has hypothesized that high...Ch. 10.6 - How would you like to live to be 200 years old?...Ch. 10.6 - Do you believe that an exceptionally high...Ch. 10.6 - A check-cashing service found that approximately...Ch. 10.6 - Prob. 56ECh. 10.6 - Prob. 57ECh. 10.6 - Prob. 58ECh. 10.8 - Why is the Z test usually inappropriate as a test...Ch. 10.8 - Prob. 62ECh. 10.8 - A chemical process has produced, on the average,...Ch. 10.8 - A coin-operated soft-drink machine was designed to...Ch. 10.8 - Operators of gasoline-fueled vehicles complain...Ch. 10.8 - Researchers have shown that cigarette smoking has...Ch. 10.8 - Nutritional information provided by Kentucky Fried...Ch. 10.8 - Prob. 68ECh. 10.8 - Two methods for teaching reading were applied to...Ch. 10.8 - A study was conducted by the Florida Game and Fish...Ch. 10.8 - Under normal conditions, is the average body...Ch. 10.8 - Prob. 72ECh. 10.8 - In Exercise 8.83, we presented some data collected...Ch. 10.8 - Prob. 74ECh. 10.8 - Prob. 75ECh. 10.8 - Prob. 76ECh. 10.8 - Prob. 77ECh. 10.9 - A manufacturer of hard safety hats for...Ch. 10.9 - Prob. 79ECh. 10.9 - Prob. 80ECh. 10.9 - Prob. 81ECh. 10.9 - Exercises 8.83 and 10.73 presented some data...Ch. 10.9 - Prob. 83ECh. 10.9 - An experiment published in The American Biology...Ch. 10.9 - Prob. 85ECh. 10.9 - Aptitude tests should produce scores with a large...Ch. 10.9 - Prob. 87ECh. 10.10 - Refer to Exercise 10.2. Find the power of the test...Ch. 10.10 - Prob. 89ECh. 10.10 - Refer to Exercise 10.5. a Find the power of test 2...Ch. 10.10 - Let Y1, Y2,, Y20 be a random sample of size n = 20...Ch. 10.10 - Consider the situation described in Exercise...Ch. 10.10 - For a normal distribution with mean and variance...Ch. 10.10 - Suppose that Y1, Y2, ,Yn constitute a random...Ch. 10.10 - Prob. 95ECh. 10.10 - Prob. 96ECh. 10.10 - Prob. 97ECh. 10.10 - Prob. 98ECh. 10.10 - Prob. 99ECh. 10.10 - Prob. 100ECh. 10.10 - Prob. 101ECh. 10.10 - Prob. 102ECh. 10.10 - Prob. 103ECh. 10.10 - Refer to the random sample of Exercise 10.103. a...Ch. 10.11 - Let Y1, Y2,, Yn denote a random sample from a...Ch. 10.11 - A survey of voter sentiment was conducted in four...Ch. 10.11 - Prob. 107ECh. 10.11 - Prob. 108ECh. 10.11 - Let X1, X2,, Xm denote a random sample from the...Ch. 10.11 - Show that a likelihood ratio test depends on the...Ch. 10.11 - Suppose that we are interested in testing the...Ch. 10.11 - Prob. 112ECh. 10.11 - Refer to Exercise 10.112. Show that in testing of...Ch. 10.11 - Prob. 114ECh. 10 - True or False. a If the p-value for a test is...Ch. 10 - Prob. 116SECh. 10 - Prob. 117SECh. 10 - Prob. 118SECh. 10 - Prob. 119SECh. 10 - Prob. 120SECh. 10 - Prob. 121SECh. 10 - Prob. 122SECh. 10 - A pharmaceutical manufacturer purchases a...Ch. 10 - Prob. 124SECh. 10 - Prob. 125SECh. 10 - Prob. 126SECh. 10 - Prob. 127SECh. 10 - Prob. 128SECh. 10 - Prob. 129SECh. 10 - Prob. 130SE
Knowledge Booster


Learn more about
Need a deep-dive on the concept behind this application? Look no further. Learn more about this topic, statistics and related others by exploring similar questions and additional content below.Similar questions
- A study of the properties of metal plate-connected trusses used for roof support yielded the following observations on axial stiffness index (kips/in.) for plate lengths 4, 6, 8, 10, and 12 in: 4: 333.2 409.5 311.0 326.5 316.8 349.8 309.7 6: 433.1 347.2 361.0 404.5 331.0 348.9 381.7 8: 382.4 366.2 351.0 357.1 409.9 367.3 382.0 10: 350.7 452.9 461.4 433.1 410.6 384.2 362.6 12: 413.4 441.8 419.9 410.7 473.4 441.2 465.8 LUSE SALT Does variation in plate length have any effect on true average axial stiffness? State the relevant hypotheses using analysis of variance. O Hoi Hy #fly #Hz" Ha #Hs H: all five μ's are equal O Hoi H₂H₂ = H3 = HaHs H: at least two μ's are unequal O Hoi H₂ = H₂ = H₂ "HaHs H: all five μ's are unequal O Hoi H₂ #4₂ # Hz*H4 *H5 H: at least two μ's are equal Test the relevant hypotheses using analysis of variance with a = 0.01. Display your results in an ANOVA table. (Round your answers to two decimal places.) Degrees of Sum of Mean freedom Squares Squares Error Total…arrow_forwardAn article in the Fire Safety Journal (“The Effect of Nozzle Design on the Stability and Performance of Turbulent Water Jets,” Vol. 4, August 1981) describes an experiment in which a shape factor was determined for several different nozzle designs at six levels of jet efflux velocity. Interest focused on potential differences between nozzle designs (blocks), with velocity considered as a nuisance variable. The data are shown below: Jet Efflux Velocity (m/s) Nozzle Design 11.73 14.37 16.59 20.43 23.46 28.74 1 0.78 0.80 0.81 0.75 0.77 0.78 2 0.85 0.85 0.92 0.86 0.81 0.83 3 0.93 0.92 0.95 0.89 0.89 0.83 4 1.14 0.97 0.98 0.88 0.86 0.83 5 0.97 0.86 0.78 0.76 0.76 0.75 1) Write the null hypothesis and the alternative hypothesis (for the factor). 2) Find the ANOVA table. (round to five decimal places). 3) What is your decision about the null hypothesis, consider ?. 4) If your decision in part (4) was reject , perform Tukey test to determine which pairwise means are…arrow_forwardThe "spring-like effect" in a golf club could be determined by measuring the coefficient of restitution (the ratio of the outbound velocity to the inbound velocity of a golf ball fired at the clubhead). Twelve randomly selected drivers produced by two clubmakers are tested and the coefficient of restitution measured. The data follow: Club 1: 0.8406, 0.8104, 0.8234, 0.8198, 0.8235, 0.8562, 0.8123, 0.7976, 0.8184, 0.8265, 0.7773, 0.7871 Club 2: 0.8305, 0.7905, 0.8352, 0.8380, 0.8145, 0.8465, 0.8244, 0.8014, 0.8309, 0.8405, 0.8256, 0.8476 Test the hypothesis that both brands of ball have equal mean overall distance. Use α = 0.05 and assume equal variances. Question: Reject H0 if t0 < ___ or if t0 > ___.arrow_forward
- A study of the properties of metal plate-connected trusses used for roof support yielded the following observations on axial stiffness index (kips/in.) for plate lengths 4, 6, 8, 10, and 12 in: 4: 321.2 409.5 311.0 326.5 316.8 349.8 309.7 6: 439.1 347.2 361.0 404.5 331.0 348.9 381.7 8: 390.4 366.2 351.0 357.1 409.9 367.3 382.0 10: 362.7 452.9 461.4 433.1 410.6 384.2 362.6 12: 402.4 441.8 419.9 410.7 473.4 441.2 465.8 USE SALT Does variation in plate length have any effect on true average axial stiffness? State the relevant hypotheses using analysis of variance. ○ Ho: H₁ = H₂ = H3 = H4=H5 Ha: all five u's are unequal O Ho: H₁ H₂ H3 H4 H5 Ha: all five μ's are equal Ho H₁ = ₂ = 3 = H4 = 5 H₂: at least two μ's are unequal Ho: H₁ H₂ H3 H4 H5 Ha: at least two μ's are equal Test the relevant hypotheses using analysis of variance with a = 0.01. Display your results in an ANOVA table. (Round your answers to two decimal places.) Mean Degrees of Sum of freedom Squares Squares Source Treatments…arrow_forwardA study of the properties of metal plate-connected trusses used for roof support yielded the following observations on axial stiffness index (kips/in.) for plate lengths 4, 6, 8, 10, and 12 in: 4: 323.2 409.5 311.0 326.5 316.8 349.8 309.7 6: 423.1 347.2 361.0 404.5 331.0 348.9 381.7 8: 393.4 366.2 351.0 357.1 409.9 367.3 382.0 10: 362.7 452.9 461.4 433.1 410.6 384.2 362.6 12: 418.4 441.8 419.9 410.7 473.4 441.2 465.8 Does variation in plate length have any effect on true average axial stiffness? State the relevant hypotheses using analysis of variance. H0: ?1 ≠ ?2 ≠ ?3 ≠ ?4 ≠ ?5Ha: at least two ?i's are equalH0: ?1 = ?2 = ?3 = ?4 = ?5Ha: all five ?i's are unequal H0: ?1 = ?2 = ?3 = ?4 = ?5Ha: at least two ?i's are unequalH0: ?1 ≠ ?2 ≠ ?3 ≠ ?4 ≠ ?5Ha: all five ?i's are equal Test the relevant hypotheses using analysis of variance with ? = 0.01. Display your results in an ANOVA table. (Round your answers to two decimal places.) Source Degrees offreedom Sum…arrow_forwardThis dataset includes measurements of soil temperature and soil respiration at three places along the riverbank (upper, mid, and lower; the upper site is far away from water and the lower site is close to water). Please help describe and interpret the results below:arrow_forward
- An experiment was conducted to study the extrusion process of biodegradable packaging foam. Two of the factors considered for their effect on the foam diameter (mm) were the die temperature(145°C vs.155°C) and the die diameter (3 mm vs. 4 mm). The results are in the accompanying data table. The question are attached in a photoarrow_forwardA river was contaminated with waste materials. Specimens of these materials were collected andtheir physical appearance recorded as shown in Table 3. Is there evidence of association betweencolor and texture for these waste materials based on the given hypothesis? Explain your findings.Use ? = 0.05.H0: No relationship between texture and colourH1: Relationship exist between texture and colour colour colour colour texture light medium dark fine 4 20 8 medium 5 23 12 coarse 21 23 4arrow_forwardAn experiment was conducted to study the extrusion process of biodegradable packaging foam. Two of the factors considered for their effect on the unit density (mg/ml) were the die temperature (145 °C vs. 155 °C) and the die diameter (3 mm vs. 4 mm). The results are stored in [Packaging Foam 1]. Source: Data extracted from W. Y. Koh, K. M. Eskridge, and M. A. Hanna, "Supersaturated Split-Plot Designs," Journal of Quality Technology, 45, January 2013, pp. 61-72.At the 0.05 level of significance, 3mm 4mm 57.22 145 72.54 145 53.60 66.70 145 48.13 49.28 145 69.89 44.14 145 62.78 58.37 145 55.18 53.98 155 57.50 63.03 155 54.17 46.73 155 73.86 60.17 155 90.28 46.78 155 88.19 43.27 155 82.61 56.93 Die Temperature a. is there an interaction between die temperature and die diameter? b. is there an effect due to die temperature? c. is there an effect due to die diameter? d. Plot the mean unit density for each die temperature for each die diameter. e. What can you conclude about the effect of die…arrow_forward
- "Durable press" cotton fabrics are treated to improve their recovery from wrinkles after washing. "Wrinkle recovery angle" measures how well a fabric recovers from wrinkles. Higher is better. Here are data on the wrinkle recovery angle (in degrees) for two types of treated fabrics: Permafresh Hylite 10 15 12 18 15 19 11 17 13 14 A manufacturer wants to know how large is the difference in mean wrinkle recovery angle. Give a 90% confidence interval for the difference in mean wrinkle recovery angle: [three decimal accuracy] [three decimal accuracy]arrow_forwardThe following data represent the results obtained from the specific gravity (S.G.) test performed in a soil laboratory including ?for sand samples. Find the mode Specific Gravity 2.30-2.39 Number of Samples 2.40-2.49 4 2.50-2.59 6. 2.60-2.69 12 2.70-2.79 14 2.80-2.89 2arrow_forwardThe determination of the shear strength of spot welds is relatively difficult, whereas measuring the weld diameter of spot welds is relatively simple. As a result, it would be advantageous if shear strength could be predicted from a measurement of weld diameter. The data are as follows: Shear strength (psi) Weld diameter (0.0001 in) 370 400 780 800 1210 1250 1560 1600 1980 2000 2450 2500 3070 3100 3550 3600 3940 4000 3950 4000 a) Test the hypothesis that the slope of the regression line is equal to 1 at the 0.05 level of significance.arrow_forward
arrow_back_ios
SEE MORE QUESTIONS
arrow_forward_ios
Recommended textbooks for you
 MATLAB: An Introduction with ApplicationsStatisticsISBN:9781119256830Author:Amos GilatPublisher:John Wiley & Sons Inc
 Probability and Statistics for Engineering and th...StatisticsISBN:9781305251809Author:Jay L. DevorePublisher:Cengage Learning
 Statistics for The Behavioral Sciences (MindTap C...StatisticsISBN:9781305504912Author:Frederick J Gravetter, Larry B. WallnauPublisher:Cengage Learning
 Elementary Statistics: Picturing the World (7th E...StatisticsISBN:9780134683416Author:Ron Larson, Betsy FarberPublisher:PEARSON
 The Basic Practice of StatisticsStatisticsISBN:9781319042578Author:David S. Moore, William I. Notz, Michael A. FlignerPublisher:W. H. Freeman
 Introduction to the Practice of StatisticsStatisticsISBN:9781319013387Author:David S. Moore, George P. McCabe, Bruce A. CraigPublisher:W. H. Freeman
MATLAB: An Introduction with Applications
Statistics
ISBN:9781119256830
Author:Amos Gilat
Publisher:John Wiley & Sons Inc
Probability and Statistics for Engineering and th...
Statistics
ISBN:9781305251809
Author:Jay L. Devore
Publisher:Cengage Learning
Statistics for The Behavioral Sciences (MindTap C...
Statistics
ISBN:9781305504912
Author:Frederick J Gravetter, Larry B. Wallnau
Publisher:Cengage Learning
Elementary Statistics: Picturing the World (7th E...
Statistics
ISBN:9780134683416
Author:Ron Larson, Betsy Farber
Publisher:PEARSON
The Basic Practice of Statistics
Statistics
ISBN:9781319042578
Author:David S. Moore, William I. Notz, Michael A. Fligner
Publisher:W. H. Freeman
Introduction to the Practice of Statistics
Statistics
ISBN:9781319013387
Author:David S. Moore, George P. McCabe, Bruce A. Craig
Publisher:W. H. Freeman
Introduction to experimental design and analysis of variance (ANOVA); Author: Dr. Bharatendra Rai;https://www.youtube.com/watch?v=vSFo1MwLoxU;License: Standard YouTube License, CC-BY