
(a)
To sketch: The shaded solution part of the graph of given system of inequalities.
(a)
Explanation of Solution
The given systems of inequalities are,
Choose any point in the x-y plane and check whether that point satisfies the inequalities or not, if yes then shade that portion of the graph.
Check for another point
Substitute 3 for x and 2 for y in equation (1).
This point satisfies the inequality,
Therefore, the shaded portion of the graph is on the right side of the graph
Plot the graph of the inequality according to the above solution.
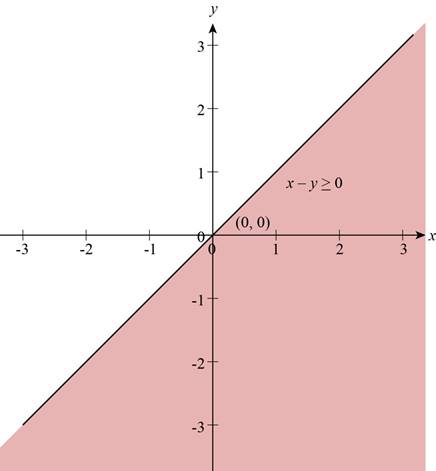
Figure (1)
Figure (1) shows the graph of the inequality
Substitute 3 for x and 2 for y in equation (1).
This point also satisfies the inequality,
Therefore, the shaded portion is on the right side of the graph. and away from the origin.
Plot the graph according to the above solution.
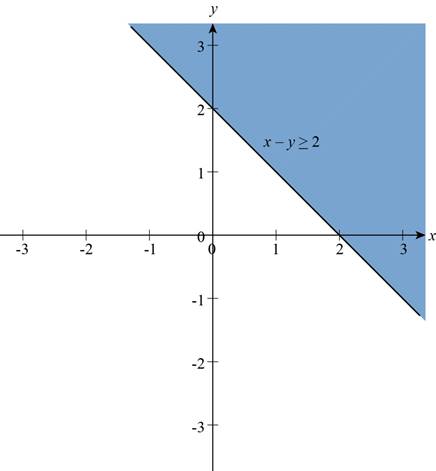
Figure (2)
The Figure (2) shows the graph of the inequality
Draw both the inequalities on the same plane and shade the common solution of the given system of inequalities,
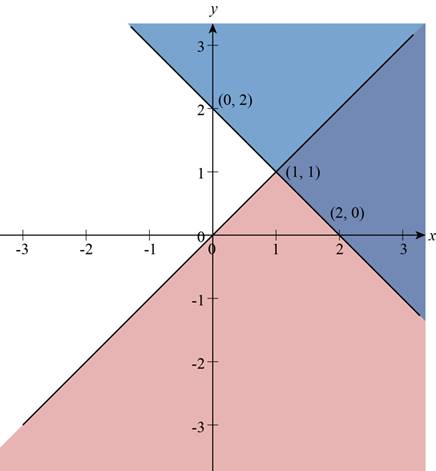
Figure (3)
The Figure (a) shows the graph of the inequality.
(b)
To sketch: The shaded solution part of the graph of given system of inequalities.
(b)
Explanation of Solution
The given systems of inequalities are,
Choose any point in the x-y plane and check whether that point satisfies the inequalities or not, if yes then shade that portion of the graph
Now, check for another point
Substitute 1 for x and 2 for y in both the equations.
From equation (1)
This point satisfies the inequality,
Therefore, the shaded portion of the graph is on the left side of the graph
Plot the graph of the inequality according to the above solution.
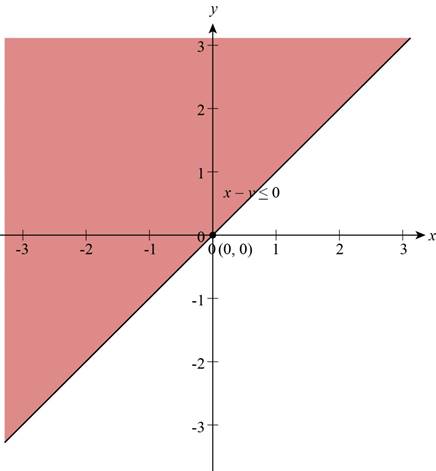
Figure (4)
The Figure (4) shows the graph of the inequality
From, equation (2)
This point does not satisfies the inequality,
Therefore, the shaded portion is on the left side of the graph. and towards the origin.
Plot the graph of the inequality according to the above solution.
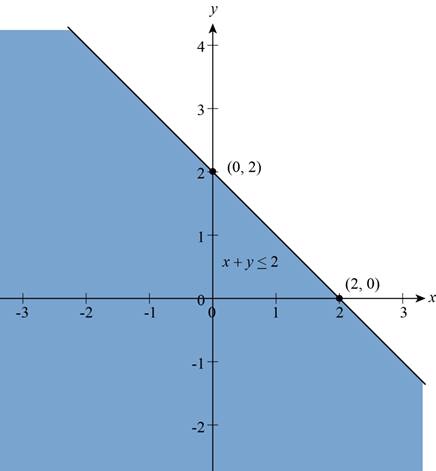
Figure (5)
The Figure (5) shows the graph of the inequality
Plot both the inequalities on the same plane and shade the common solution of the given system of inequalities,
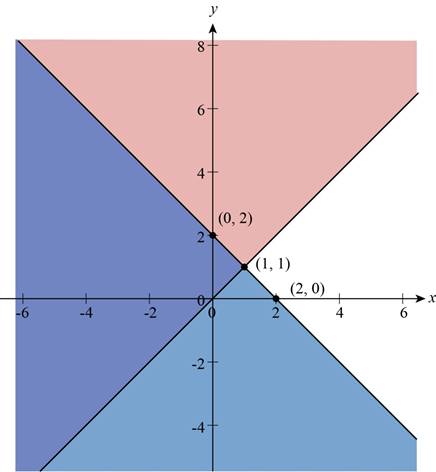
Figure (6)
Figure (6) shows the graph of the given inequalities
(c)
To sketch: The shaded solution part of the graph of given system of inequalities.
(c)
Explanation of Solution
The given systems of inequalities are,
Choose any point in the x-y plane and check whether that point satisfies the inequalities or not, if yes then shade that portion of the graph
Check for another point
Substitute 3 for x and 2 for y in both the equations.
From equation (1)
This point satisfies the inequality,
Therefore, the shaded portion of the graph is on the right side of the graph
Plot the graph of the inequality according to the above solution.
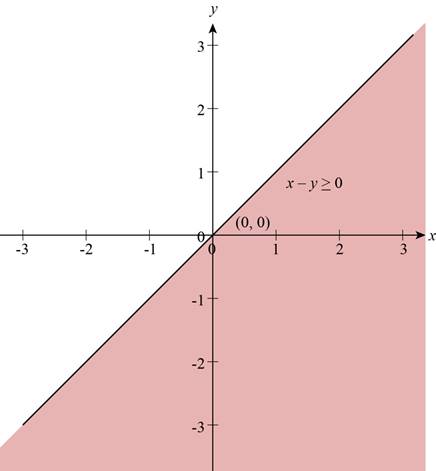
Figure (1)
Figure (1) shows the graph of the inequality
From equation (2)
This point does not satisfies the inequality,
Therefore, the shaded portion is on the left side of the graph and towards the origin.
Therefore, the shaded portion is on the left side of the graph. and towards the origin.
Plot the graph of the inequality according to the above solution.
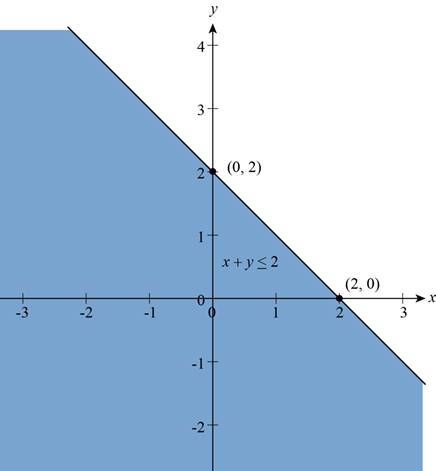
Figure (5)
The Figure (5) shows the graph of the inequality
Plot both the inequalities on the same plane and Shade the common solution of the given system of inequalities.
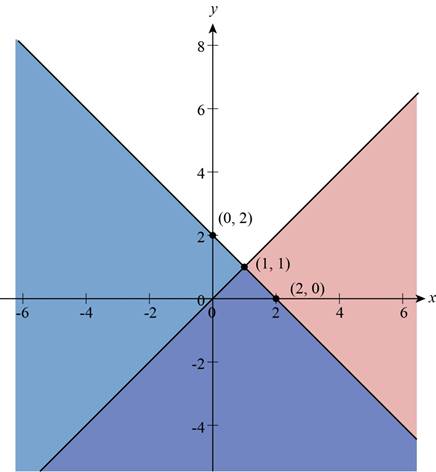
Figure (7)
Figure (7) shows the graph of the given inequalities
(d)
To sketch: The shaded solution part of the graph of given system of inequalities.
(d)
Explanation of Solution
The given systems of inequalities are,
Choose any point in the x-y plane and check whether that point satisfies the inequalities or not, if yes then shade that portion of the graph
Now, check for another point
Substitute 1 for x and 2 for y in both the equations.
From equation (1)
This point satisfies the inequality,
Therefore, the shaded portion of the graph is on the left side of the graph
Plot the graph of the inequality according to the above solution.
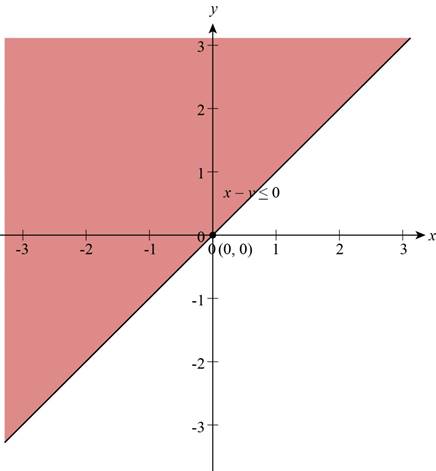
Figure (4)
The Figure (4) shows the graph of the inequality
From, equation (2)
This point satisfies the inequality,
Therefore, the shaded portion is on the right side of the graph. and away from the origin.
Plot the graph of the inequality according to the above solution.

Figure (5)
The Figure (5) shows the graph of the inequality
Plot the graph of both the inequalities on the same plane and shade the common solution of the given system of inequalities,
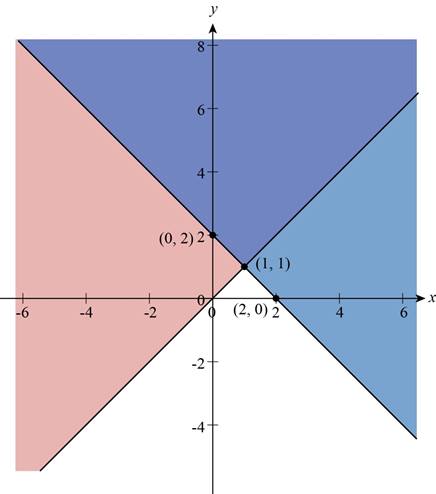
Figure (8)
Figure (8) shows the graph of the given inequalities
Chapter 10 Solutions
Precalculus: Mathematics for Calculus - 6th Edition
- Let I = f(x) dx, where f is the function whose graph is shown. 4 2 y f X 1 2 3 4 (a) Use the graph to find L2, R2 and M2. R₂ M2 = = = (b) Are these underestimates or overestimates of I? O 42 is an underestimate. O 42 is an overestimate. ◇ R2 is an underestimate. OR2 is an overestimate. OM2 is an underestimate. ○ M2 is an overestimate. (c) Use the graph to find T2. T₂ =arrow_forwardVector u has a magnitude of 23 and vector v has a magnitude of 83. The angle between the two vectors is 126 degrees.a) Draw a fully-labelled vector diagram showing the two vectors and the resultant vector when they are added together.b) Find the magnitude of the resultant vector.c) Find the direction of the resultant vector relative to vector u. Solding by finding the x and y of the vectors and addingarrow_forwardFind the range and all the answers. Remark that the range isn’t between -(pi/2) and (pi/2)arrow_forward
- 16. Solve each of the following equations for x. (a) 42x+1 = 64 (b) 27-3815 (c) 92. 27² = 3-1 (d) log x + log(x - 21) = 2 (e) 3 = 14 (f) 2x+1 = 51-2xarrow_forward11. Find the composition fog and gof for the following functions. 2 (a) f(x) = 2x+5, g(x) = x² 2 (b) f(x) = x²+x, g(x) = √√x 1 (c) f(x) = -1/2) 9 9(x) = х = - Xarrow_forwardpractice problem please help!arrow_forward
- 13. A restaurant will serve a banquet at a cost of $20 per person for the first 50 people and $15 for person for each additional person. (a) Find a function C giving the cost of the banquet depending on the number of people p attending. (b) How many people can attend the banquet for $2000?arrow_forwardAlt Fn Ctrl 12. Find functions f and g such that h(x) = (fog)(x). (a) h(x) = (x² + 2)² x+1 (b) h(x) = 5 3arrow_forward15. Find the exact value. (a) log4 16 (b) log7 1 49 (c) logs 3/25arrow_forward
 Calculus: Early TranscendentalsCalculusISBN:9781285741550Author:James StewartPublisher:Cengage Learning
 Thomas' Calculus (14th Edition)CalculusISBN:9780134438986Author:Joel R. Hass, Christopher E. Heil, Maurice D. WeirPublisher:PEARSON
 Calculus: Early Transcendentals (3rd Edition)CalculusISBN:9780134763644Author:William L. Briggs, Lyle Cochran, Bernard Gillett, Eric SchulzPublisher:PEARSON
 Calculus: Early TranscendentalsCalculusISBN:9781319050740Author:Jon Rogawski, Colin Adams, Robert FranzosaPublisher:W. H. Freeman
 Calculus: Early Transcendental FunctionsCalculusISBN:9781337552516Author:Ron Larson, Bruce H. EdwardsPublisher:Cengage Learning


