
Videos
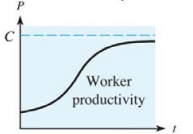
Productivity The figure is a typical graph of worker productivity per hour P as a function of time t on the job.
(a) What is the horizontal asymptote?
(b) What is
(c) What is the horizontal asymptote for
(d) What is
Want to see the full answer?
Check out a sample textbook solution
Chapter 10 Solutions
Mathematical Applications for the Management, Life, and Social Sciences


- Heat Gain The following graphs show the typical heat gain, in BTU per hour per square foot, for windows one with plain glass and one that is triple glazed in Pittsburgh in June, one facing east and one facing south. The horizontal axis gives the time of the day. Estimate the total heat gain per square foot by summing the areas of rectangle. Use rectangles with widths of 2hours, and let the function value at the midpoint of the subinterval give the height of rectangle. Source: Sustainable by Design. a. Estimate the total heat gain per square foot for a plain glass window facing south. b. Estimate the total heat gain per square foot for a triple glazed window facing south.arrow_forwardConsumer Demand When the price of an essential commodity rises rapidly, consumption drops slowly at first. If the price continues to rise, however, a tipping point may be reached, at which consumption takes a sudden substantial drop. Suppose the accompanying graph shows the consumption of gasoline, G(t), in millions of gallons, in a certain area. We assume that the price is risign rapidly. Here t is the time in months after the price began rising. Sketcha graph of the rate of change in consumption as a function of time.arrow_forwardFor the function h whose graph is given, state the value of each quantity, if it exists. (Ir an answer does not exist, enter DNE.) y 4 -2 4 (a) lim h(x) X--3 (b) lim h(x) (c) lim h(x) X--3 (d) h(-3) (e) lim h(x) (r) lim h(x) (g) lim h(x) (h) h(0) (i) lim h(x) X-2 U) h(2) (k) lim h(x) (1) lim h(x)arrow_forward
- Cost of Natural Gas In March 2014, Laclede Gas had the rate schedule (on, right) for natural gas usage in single-family residences. (a) What is the charge for using 20 therms in a month? (b) What is the charge for using 150 therms in a month?(c) Develop a function that models the monthly charge C for x therms of gas. (d) Graph the function found in part (c).arrow_forwardFor the function g whose graph is given, state the value of each quantity, if it exists. (If an answer does not exist, enter DNE.) (a) lim g(t) t-0 lim g(t) t- 0* (b) (c) lim g(t) t-0 lim g(t) (d) t- 2 (e) lim g(t) t- 2* (f) lim g(t) (g) g(2) lim g(t) t+ 4 (h)arrow_forward44. (a) Find the vertical asymptotes of the function x? + 1 y : 3x 2.x?arrow_forward
- A can in the shape of a right circular cylinder is required to have a volume of 250 cubic centimeters.(a) Express the amount A of material to make the can as a function of the radius r of the cylinder.(b) How much material is required if the can is of radius 3 centimeters?(c) How much material is required if the can is of radius 5 centimeters?(d) Graph A = A(r). For what value of r is A smallest?arrow_forwardFind any asymptotes and relative extrema that may exist and use a graphing utility to graph the function y = x1/x, x > 0arrow_forward() Find all the horizontal asymptotes of the function f(x)=x tan Show and explain your work.arrow_forward
- Consider the function INTERMEDIATE WORK Domain= Vertical asymptotes : x = Horizontal asymptotes : y = y' Using calculus give a sketch of y. Make sure you include the following include the following information. If you have more than one answer, give your answer as a comma separated list. If you have none, write "None". = Cusps: Vertical tangent lines: Intervals of increase : Intervals of decrease : Local maxima: Local minima: Saddle points: y" = Intervals on which y is concave up : Intervals on which y is concave down : Points of inflection : y=5+ = 4 x8 + 224 x⁹arrow_forwardA drug is administered to a patient, and the concentration of the drug in the bloodstream is monitored. At time t ≥ 0 (in hours since giving the drug) the concentration (in mg/L) is given by c(t) = 8t/t^2+4 Graph the function c with a graphing device. (Round your answers to two decimal places.) (a) What is the highest concentration of drug that is reached in the patient's bloodstream? c = mg/L (c) How long does it take for the concentration to drop below 0.5 mg/L? t = hrarrow_forwarda) Determine x and y intercepts, asymptotes (horizontal and vertical), domain, range, positive/negative interval, increase/decrease intervals. b) Sketch the function. Be sure to label intercepts and asymptotes clearly. 2. In a laboratory, it takes 19.0 days for 40.0kg of a substance to decay to 12.0kg. What is the half life of the substance? (Please Round final answer to two decimal places)arrow_forward
 Algebra for College StudentsAlgebraISBN:9781285195780Author:Jerome E. Kaufmann, Karen L. SchwittersPublisher:Cengage Learning
 Algebra & Trigonometry with Analytic GeometryAlgebraISBN:9781133382119Author:SwokowskiPublisher:Cengage
 Calculus For The Life SciencesCalculusISBN:9780321964038Author:GREENWELL, Raymond N., RITCHEY, Nathan P., Lial, Margaret L.Publisher:Pearson Addison Wesley,