
Videos
Performing a One-Way ANOVA Test In Exercises 5−14, (a) identify the claim and state H0 and Ha. (b) find the critical value and identify the rejection region, (c) find the test statistic F, (d) decide whether to reject or fail to reject the null hypothesis, and (e) interpret the decision in the context of the original claim. Assume the samples are random and independent, the populations are
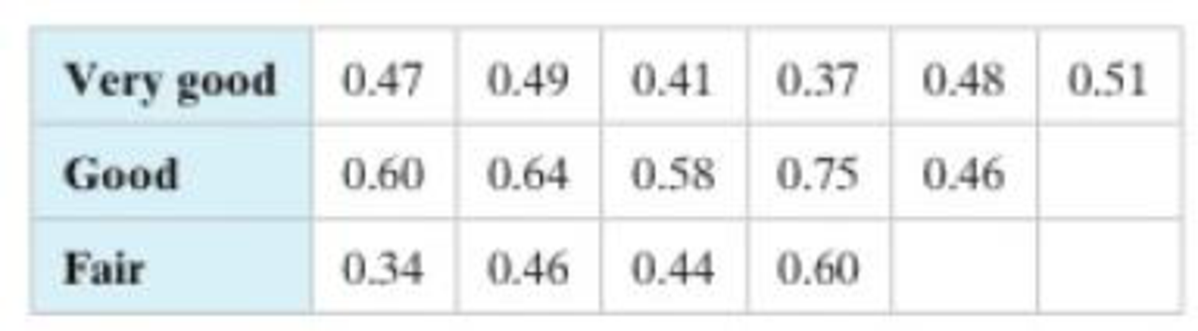
5. Toothpaste The table shows the costs per ounce (in dollars) for a sample of toothpastes exhibiting very good slain removal, good stain removal, and fair stain removal. At a = 0.05, can you conclude that at least one
Want to see the full answer?
Check out a sample textbook solution
Chapter 10 Solutions
Elementary Statistics: Picturing the World (6th Edition)


- Please help me with the following question on statisticsFor question (e), the drop down options are: (From this data/The census/From this population of data), one can infer that the mean/average octane rating is (less than/equal to/greater than) __. (use one decimal in your answer).arrow_forwardHelp me on the following question on statisticsarrow_forward3. [15] The joint PDF of RVS X and Y is given by fx.x(x,y) = { x) = { c(x + { c(x+y³), 0, 0≤x≤ 1,0≤ y ≤1 otherwise where c is a constant. (a) Find the value of c. (b) Find P(0 ≤ X ≤,arrow_forward
- Need help pleasearrow_forward7. [10] Suppose that Xi, i = 1,..., 5, are independent normal random variables, where X1, X2 and X3 have the same distribution N(1, 2) and X4 and X5 have the same distribution N(-1, 1). Let (a) Find V(X5 - X3). 1 = √(x1 + x2) — — (Xx3 + x4 + X5). (b) Find the distribution of Y. (c) Find Cov(X2 - X1, Y). -arrow_forward1. [10] Suppose that X ~N(-2, 4). Let Y = 3X-1. (a) Find the distribution of Y. Show your work. (b) Find P(-8< Y < 15) by using the CDF, (2), of the standard normal distribu- tion. (c) Find the 0.05th right-tail percentage point (i.e., the 0.95th quantile) of the distri- bution of Y.arrow_forward
- 6. [10] Let X, Y and Z be random variables. Suppose that E(X) = E(Y) = 1, E(Z) = 2, V(X) = 1, V(Y) = V(Z) = 4, Cov(X,Y) = -1, Cov(X, Z) = 0.5, and Cov(Y, Z) = -2. 2 (a) Find V(XY+2Z). (b) Find Cov(-x+2Y+Z, -Y-2Z).arrow_forward1. [10] Suppose that X ~N(-2, 4). Let Y = 3X-1. (a) Find the distribution of Y. Show your work. (b) Find P(-8< Y < 15) by using the CDF, (2), of the standard normal distribu- tion. (c) Find the 0.05th right-tail percentage point (i.e., the 0.95th quantile) of the distri- bution of Y.arrow_forward== 4. [10] Let X be a RV. Suppose that E[X(X-1)] = 3 and E(X) = 2. (a) Find E[(4-2X)²]. (b) Find V(-3x+1).arrow_forward
- 2. [15] Let X and Y be two discrete RVs whose joint PMF is given by the following table: y Px,y(x, y) -1 1 3 0 0.1 0.04 0.02 I 2 0.08 0.2 0.06 4 0.06 0.14 0.30 (a) Find P(X ≥ 2, Y < 1). (b) Find P(X ≤Y - 1). (c) Find the marginal PMFs of X and Y. (d) Are X and Y independent? Explain (e) Find E(XY) and Cov(X, Y).arrow_forward32. Consider a normally distributed population with mean μ = 80 and standard deviation σ = 14. a. Construct the centerline and the upper and lower control limits for the chart if samples of size 5 are used. b. Repeat the analysis with samples of size 10. 2080 101 c. Discuss the effect of the sample size on the control limits.arrow_forwardConsider the following hypothesis test. The following results are for two independent samples taken from the two populations. Sample 1 Sample 2 n 1 = 80 n 2 = 70 x 1 = 104 x 2 = 106 σ 1 = 8.4 σ 2 = 7.6 What is the value of the test statistic? If required enter negative values as negative numbers (to 2 decimals). What is the p-value (to 4 decimals)? Use z-table. With = .05, what is your hypothesis testing conclusion?arrow_forward
 Functions and Change: A Modeling Approach to Coll...AlgebraISBN:9781337111348Author:Bruce Crauder, Benny Evans, Alan NoellPublisher:Cengage Learning
 College Algebra (MindTap Course List)AlgebraISBN:9781305652231Author:R. David Gustafson, Jeff HughesPublisher:Cengage Learning