(a)
To find: The 90% confidence interval for
(a)
Answer to Problem 8CR
Solution:
The 90% confidence interval for the difference of two means is
Explanation of Solution
Calculation:
Let
Let
Since all
The critical z-value for a two-tailed area of 0.10 is 1.645.
The difference of two proportions is
Now, the margin of error is computed as follows:
Now the confidence interval for the difference of two means;
The 90% confidence interval for the difference of two proportions is
(b)
To explain: The meaning of confidence interval in the context of the problem.
(b)
Explanation of Solution
Since the 90% confidence interval - 0.2027 to 0.1823 contains both positive and negative value, hence we cannot say that
(c)
(i)
The level of significance and state the null and alternative hypotheses.
(c)
(i)
Answer to Problem 8CR
Solution: The level of significance is 0.05.
Explanation of Solution
The level of significance,
The null hypothesis for testing is defined as,
The alternative hypothesis is defined as,
(ii)
The sampling distribution to be used and explain the assumptions and also find the value of the test statistics.
(ii)
Answer to Problem 8CR
Solution: The
Explanation of Solution
Calculation:
We have
Since all
The pooled estimates for
The difference of two proportions is
The sample test statistic z is given as:-
(iii)
To find: The P-value of the sample statistic and sketch the sampling distribution and show the area corresponding to the P-value.
(iii)
Answer to Problem 8CR
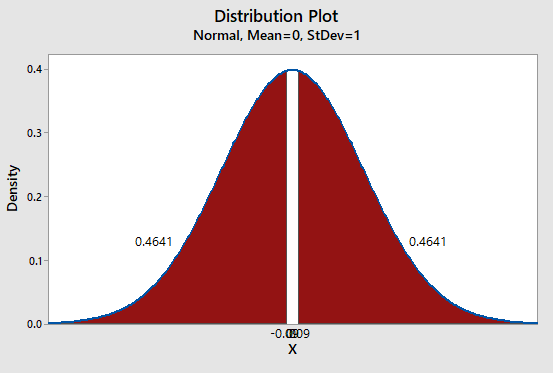
Solution: The P-value of sample statistic is 0.9362.
Explanation of Solution
Graph:
The given hypothesis test is two tailed.
By using table 4 from Appendix
Graph:
To draw the required graphs using the Minitab, follow the below instructions:
Step 1: Go to the Minitab software.
Step 2: Go to Graph > Probability distribution plot > View probability.
Step 3: Select ‘Normal’, enter Mean = 0 and standard deviation =1.
Step 4: Click on the Shaded area > X value.
Step 5: Enter X-value as -0.09 and select ‘Two tail’.
Step 6: Click on OK.
The obtained distribution graph is:

(iv)
Whether we reject or fail to reject the null hypothesis and whether the data is statistically significant for a level of significance of 0.05.
(iv)
Answer to Problem 8CR
Solution: The P-value
Explanation of Solution
The P-value (0.9362) is greater than the level of significance (
(v)
The interpretation for the conclusion.
(v)
Answer to Problem 8CR
Solution: There is not enough evidence to conclude that there is difference in the proportion of accurate responses from face to face interview compared with telephone interview.
Explanation of Solution
The P-value (0.9362) is greater than the level of significance (
There is not enough evidence to conclude that there is difference in the proportion of accurate responses from face to face interview compared with telephone interview.
Want to see more full solutions like this?
Chapter 10 Solutions
Bundle: Understanding Basic Statistics, Loose-leaf Version, 7th + WebAssign Printed Access Card for Brase/Brase's Understanding Basic Statistics, ... for Peck's Statistics: Learning from Data
- 8- 6. Show that, for any random variable, X, and a > 0, 8 心 P(xarrow_forward15. This problem extends Problem 20.6. Let X, Y be random variables with finite mean. Show that 00 (P(X ≤ x ≤ Y) - P(X ≤ x ≤ X))dx = E Y — E X.arrow_forward(b) Define a simple random variable. Provide an example.arrow_forward17. (a) Define the distribution of a random variable X. (b) Define the distribution function of a random variable X. (c) State the properties of a distribution function. (d) Explain the difference between the distribution and the distribution function of X.arrow_forward16. (a) Show that IA(w) is a random variable if and only if A E Farrow_forward15. Let 2 {1, 2,..., 6} and Fo({1, 2, 3, 4), (3, 4, 5, 6}). (a) Is the function X (w) = 21(3, 4) (w)+711.2,5,6) (w) a random variable? Explain. (b) Provide a function from 2 to R that is not a random variable with respect to (N, F). (c) Write the distribution of X. (d) Write and plot the distribution function of X.arrow_forward20. Define the o-field R2. Explain its relation to the o-field R.arrow_forward7. Show that An → A as n→∞ I{An} - → I{A} as n→ ∞.arrow_forward7. (a) Show that if A,, is an increasing sequence of measurable sets with limit A = Un An, then P(A) is an increasing sequence converging to P(A). (b) Repeat the same for a decreasing sequence. (c) Show that the following inequalities hold: P (lim inf An) lim inf P(A) ≤ lim sup P(A) ≤ P(lim sup A). (d) Using the above inequalities, show that if A, A, then P(A) + P(A).arrow_forward19. (a) Define the joint distribution and joint distribution function of a bivariate ran- dom variable. (b) Define its marginal distributions and marginal distribution functions. (c) Explain how to compute the marginal distribution functions from the joint distribution function.arrow_forward18. Define a bivariate random variable. Provide an example.arrow_forward6. (a) Let (, F, P) be a probability space. Explain when a subset of ?? is measurable and why. (b) Define a probability measure. (c) Using the probability axioms, show that if AC B, then P(A) < P(B). (d) Show that P(AUB) + P(A) + P(B) in general. Write down and prove the formula for the probability of the union of two sets.arrow_forwardarrow_back_iosSEE MORE QUESTIONSarrow_forward_ios
 Glencoe Algebra 1, Student Edition, 9780079039897...AlgebraISBN:9780079039897Author:CarterPublisher:McGraw Hill
 College Algebra (MindTap Course List)AlgebraISBN:9781305652231Author:R. David Gustafson, Jeff HughesPublisher:Cengage Learning

