
Managerial Accounting (5th Edition)
5th Edition
ISBN: 9780134128528
Author: Karen W. Braun, Wendy M. Tietz
Publisher: PEARSON
expand_more
expand_more
format_list_bulleted
Concept explainers
Videos
Textbook Question
Chapter 10, Problem 10.31BE
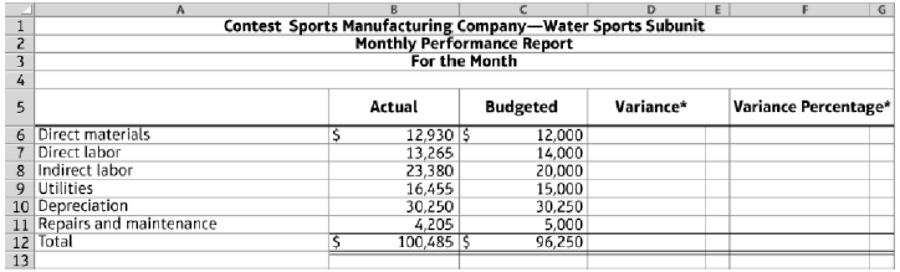
Complete and analyze a performance report (Learning Objective 2)
One subunit of Contest Sports Manufacturing Company had the following financial results last month:
10.3-21 Full Alternative Text
Requirements
- 1. Complete the performance evaluation report for this subunit (round to four decimals).
- 2. Based on the data presented, what type of responsibility center is this subunit?
- 3. Which items should be investigated if part of management’s decision criteria is to investigate all variances exceeding $2,900 or 13%?
- 4. Should only unfavorable variances be investigated? Explain.
Expert Solution & Answer
Want to see the full answer?
Check out a sample textbook solution
Students have asked these similar questions
Using responsibility reports to evaluate cost, revenue, and profit centers
The accountant for a subunit of Speed Sports Company went on vacation before completing the subunit’s monthly responsibility report. This is as far as she got:
Requirements
Complete the responsibility report for this subunit.
Based on the data presented, what type of responsibility center is this Subunit.
Which items should be investigated if part of management’s decision criteria is to investigate all variances exceeding $12,000?
Integrating decentralization and performance evaluation systems
One subunit of Track Sports Company had the following financial results last month:
Requirements
Complete the performance evaluation report for this subunit (round to two decimal places).
Based on the data presented and your knowledge of the company, what type of responsibility center is this subunit?
Which items should be investigated if part of management’s decision criteria is to investigate all variances equal to or exceeding $8,000 arm’ exceeding 10% (both criteria must be met)?
Should only unfavorable variances be investigated? Explain.
Is it possible that the variances are due to a higher-than-expected sales volume? Explain.
Will management place equal weight on each of the variances exceeding $8,000? Explain.
Which balanced scorecard perspective is being addressed through this performance report? In your opinion, is this performance report a lead or a lag indicator? Explain.
List one key performance indicator for…
Taylor Consulting makes it a practice to stay involved with the client to help them stay on track to achieve their goals. A co-worker had completed the balanced scorecard for Buckeye Electric six months ago. Your manager has instructed you to consult with Buckeye Electric management regarding any balanced scorecard item whose performance metric has achieved less than 50% of the target. Determine which Performance Metrics require a consultation. Also, indicate the Performance Perspective for each Performance Metric. This information is important because you will need to know which manager to contact.
Performance Metrics
Last Year
Target
Year to Date Consultation
Required
Performance Perspective
1. Revenue growth rate 14.0% 15.0% 14.6%
2. Utilization of asset rate 6.0% 12.0% 7.0%
3. Operating costs per customer $150 $125 $145
4. Customer satisfaction rating 80.0% 87.0% 90.0%
5. Problem resolution time 6 hr 3 hr 4 hr
6. Employee productivity rate 2.0% 3.0% 2.4%
7.…
Chapter 10 Solutions
Managerial Accounting (5th Edition)
Ch. 10 - (Learning Objective 1) Companies often...Ch. 10 - (Learning Objective 1) Which of the following is...Ch. 10 - (Learning Objective 1) In terms of responsibility...Ch. 10 - (Learning Objective 2) Which of the following is...Ch. 10 - (Learning Objective 2) A segment margin is the...Ch. 10 - Prob. 6QCCh. 10 - Prob. 7QCCh. 10 - Prob. 8QCCh. 10 - Prob. 9QCCh. 10 - Prob. 10QC
Ch. 10 - Identify and understand responsibility centers...Ch. 10 - Identify types of responsibility centers (Learning...Ch. 10 - Identify centralized and decentralized...Ch. 10 - Prob. 10.4SECh. 10 - Prob. 10.5SECh. 10 - Prob. 10.6SECh. 10 - Calculate ROI (Learning Objective 3) Refer to Epic...Ch. 10 - Prob. 10.8SECh. 10 - Prob. 10.9SECh. 10 - Prob. 10.10SECh. 10 - Prob. 10.11SECh. 10 - Interpret a performance report (Learning Objective...Ch. 10 - Prob. 10.13SECh. 10 - Classify KPIs by balanced scorecard perspective...Ch. 10 - Use vocabulary terms (Learning Objectives 1, 2, 3,...Ch. 10 - Prob. 10.16SECh. 10 - Identify type of responsibility center (Learning...Ch. 10 - Complete and analyze a performance report...Ch. 10 - Prepare a segment margin performance report...Ch. 10 - Compute and interpret the expanded ROI equation...Ch. 10 - Prob. 10.21AECh. 10 - Prob. 10.22AECh. 10 - Comparison of ROI and residual income (Learning...Ch. 10 - Prob. 10.24AECh. 10 - Comprehensive flexible budget problem (Learning...Ch. 10 - Prepare a flexible budget performance report...Ch. 10 - Work backward to find missing values (Learning...Ch. 10 - Construct a balanced scorecard (Learning Objective...Ch. 10 - Sustainability and the balanced scorecard...Ch. 10 - Identify type of responsibility center (Learning...Ch. 10 - Complete and analyze a performance report...Ch. 10 - Prob. 10.32BECh. 10 - Prob. 10.33BECh. 10 - Prob. 10.34BECh. 10 - Prob. 10.35BECh. 10 - Prob. 10.36BECh. 10 - Prob. 10.37BECh. 10 - Prob. 10.38BECh. 10 - Prob. 10.39BECh. 10 - Prob. 10.40BECh. 10 - Prob. 10.41BECh. 10 - Sustainability and the balanced scorecard...Ch. 10 - Prepare a budget with different volumes for...Ch. 10 - Prepare and interpret a performance report...Ch. 10 - Prob. 10.45APCh. 10 - Prob. 10.46APCh. 10 - Prob. 10.47APCh. 10 - Evaluate subunit performance (Learning Objectives...Ch. 10 - Prob. 10.49BPCh. 10 - Prob. 10.50BPCh. 10 - Evaluate divisional performance (Learning...Ch. 10 - Prob. 10.52BPCh. 10 - Determine transfer price at a manufacturer under...Ch. 10 - Evaluate subunit performance (Learning Objectives...Ch. 10 - Prob. 10.55SC
Knowledge Booster


Learn more about
Need a deep-dive on the concept behind this application? Look no further. Learn more about this topic, accounting and related others by exploring similar questions and additional content below.Similar questions
- Hyperflash Inc. has a balanced scorecard that includes the following relationships: Actual results for this month and last month are as follows: Instructions 1.Analyze these data to verify whether they support the expected relationship between the strategic objectives and performance metrics. 2.Identify three possible reasons for any unsupported relationship you identified in part (1). 3.Which of the three possibilities you identified in part (2) is the most likely reason for the unsupported relationship you identified in part (1)?arrow_forwardA marketing professor at Givens College is interested in the relationship between hours spent studying and total points earned in a course. Data collected on 156 students who took the course last semester are provided in the tile MktHrsPts. Develop a scatter chart for these data. What does the scatter chart indicate about the relationship between total points earned and hours spent studying? Develop an estimated regression equation showing how total points earned is related to hours spent studying. What is the estimated regression model? Test whether each of the regression parameters β0 and β1 is equal to zero at a 0.01 level of significance. What are the correct interpretations of the estimated regression parameters? Are these interpretations reasonable? How much of the variation in the sample values of total point earned does the model you estimated in part (b) explain? Mark Sweeney spent 95 hours studying. Use the regression model you estimated in part (b) to predict the total points Mark earned.arrow_forwardEye Swear Inc. has a balanced scorecard that includes the following relationships: Actual results for this year and last year are as follows: Instructions 1.Analyze these statistics to verify whether they support the expected relationships between the strategic objectives and performance metrics. 2.Identify three possible reasons for any unsupported relationship you identified in part (1). 3.Which of the three possibilities you identified in part (2) is the most likely reason for the unsupported relationship you identified in part (1)?arrow_forward
- The controller of Emery, Inc. has computed quality costs as a percentage of sales for the past 5 years (20X1 was the first year the company implemented a quality improvement program). This information is as follows: Required: 1. Prepare a trend graph for total quality costs. Comment on what the graph has to say about the success of the quality improvement program. 2. Prepare a graph that shows the trend for each quality cost category. What does the graph have to say about the success of the quality improvement program? Does this graph supply more insight than the total cost trend graph does? 3. Prepare a graph that compares the trend in relative control costs versus relative failure costs. Comment on the significance of this trend.arrow_forwardStudy the performance report for Barbaras Bistro in Figure 1-2 of the chapter and write a brief explanation of the strengths and weaknesses of September and year-to-date operations.arrow_forwardAdams Corporation evaluates divisional managers based on Return on Investment (ROI) and has provided the operating results of the Northern DIVislon from last year. The Controller has asked you to compute the ROI and Residual Income based on data from last year and If the alvislon adds a new product line. Use the Information Included in the Excel Simulation and the Excel functions described below to complete the task. • Cell Reference: Allows you to refer to data from another cell in the worksheet. From the Excel Simulation below, if in a blank cell, "=G5" was entered, the formula would output the result from cell G5, or 4.00 In this example. • Basic Math functions: Allows you to use the basic math symbols to perform mathematical functions. You can use the following keys: - (plus sign to add), - (minus sign to subtract). * (asterisk sign to multiply), and (forward slash to divide). From the Excel Simulation below, If in a blank cell "=G5-G6" was entered, the formula would add the values…arrow_forward
- At the end of 20x1, Mejorar Company implemented a low-cost strategy to improve its competitive position. Its objective was to become the low-cost producer in its industry. A Balanced Scorecard was developed to guide the company toward this objective. To lower costs, Mejorar undertook a number of improvement activities such as JIT production, total quality management, and activity-based management. Now, after two years of operation, the president of Mejorar wants some assessment of the achievements. To help provide this assessment, the following information on one product has been gathered: Required: 1. Compute the following measures for 20x1 and 20x3: a. Actual velocity and cycle time b. Percentage of total revenue from new customers (assume one unit per customer) c. Percentage of very satisfied customers (assume each customer purchases one unit) d. Market share e. Percentage change in actual product cost (for 20x3 only) f. Percentage change in days of inventory (for 20x3 only) g. Defective units as a percentage of total units produced h. Total hours of training i. Suggestions per production worker j. Total revenue k. Number of new customers 2. For the measures listed in Requirement 1, list likely strategic objectives, classified according to the four Balance Scorecard perspectives. Assume there is one measure per objective.arrow_forwardEthics in Action In August, Lannister Company introduced a new performance measurement system in manufacturing operations. One of the new performance measures is lead time, which is determined by tagging a random sample of items with a log sheet throughout the month. The log sheets recorded the time that the sample items started production and the time that they ended production, as well as all steps in between. At the end of the month, the controller collected the log sheets and computed the average lead time of the tagged products. This number was reported to central management and was used to evaluate the performance of the plant manager. Because of the poor lead time results reported for August, the plant was under extreme pressure to reduce lead time in September. The following memo was intercepted by the controller. Date: September 3 To: Hourly Employees From: Plant Manager During last month, you may have noticed that some of the products were tagged with a log sheet. This sheet records the time that a product enters production and the time that it leaves production. The difference between these two times is termed the lead time. Our plant is evaluated on improving lead time. From now on, I ask all of you to keep an eye out for the tagged items. When you see a tagged item, it is to receive special attention. Work on that item first, and then immediately move it to the next operation. Under no circumstances should tagged items wait on any other work that you have. Naturally, report accurate information. I insist that you record the correct times on the log sheet as the product goes through your operations. How should the controller respond to this discovery?arrow_forwardDetermine if the selection of system 1 or 2 is sensitive to variation in the return required by management. The corporate MARR ranges from 8% to16% per year on different projects. Use tabulated factors or a spreadsheet, as requested by your instructor.arrow_forward
- One subunit of Soaring Sports Manufacturing Company had the following financial results last month: E (Click the icon to view the financial results.) Requirements 1. Complete the performance evaluation report for this subunit. 2. Based on the data presented, what type of responsibility center is the subunit? 3. Which items should be investigated if part of the management's decision criteria is to investigate all variances exceeding $3,200 or 11%? 4. Should only unfavorable variances be investigated? Explain. Requirement 1. Complete the performance evaluation report for this subunit. (Enter the variances as positive numbers. Rour (U). If the variance is 0, make sure to enter in a "0". A variance of zero is considered favorable.) Data table Variance B E Variance Percentage Soaring Sports Manufacturing Company-Golf Accessories Subunit Product Actual Budgeted (U or F) (U or F) 2 Monthly Performance Report Direct materials 26,925 $ 25,000 3 For the Month Direct labor 14,235 15,000 U %…arrow_forwardWhich of the following is a reason for a company to implement a knowledge management system? Select one: O a. Some of the company's policies and procedures will be revised in the coming year. O b. A new Human Resources manager who is a recent, external hire is telling everyone that a KMS is the way to go and that she used one at her old company. Oc. There is leftover budget money at the end of the year, and the IT department thinks a new software program is the way to spend it. Od. An early retirement program was offered, and many senior managers across the organization are interested in taking advantage of it.arrow_forwardThe following if-then statements were taken from a Balanced Scorecard: a. If employee capabilities increase, then process time decreases. b. If process time decreases, then customer retention will increase. c. If customer retention increases, then market share will increase. d. If market share increases, then revenues will increase. Required: 1. Identify the lead and lag variables, and explain your reasoning. 2. Discuss the implications of Requirement 1 for the financial and learning and growth perspectives. 3. Using the first if-then statement, explain the concept of double-loop feedback.arrow_forward
arrow_back_ios
SEE MORE QUESTIONS
arrow_forward_ios
Recommended textbooks for you
 Excel Applications for Accounting PrinciplesAccountingISBN:9781111581565Author:Gaylord N. SmithPublisher:Cengage Learning
 Managerial Accounting: The Cornerstone of Busines...AccountingISBN:9781337115773Author:Maryanne M. Mowen, Don R. Hansen, Dan L. HeitgerPublisher:Cengage Learning
 Financial And Managerial AccountingAccountingISBN:9781337902663Author:WARREN, Carl S.Publisher:Cengage Learning,
 Managerial AccountingAccountingISBN:9781337912020Author:Carl Warren, Ph.d. Cma William B. TaylerPublisher:South-Western College Pub
 Cornerstones of Cost Management (Cornerstones Ser...AccountingISBN:9781305970663Author:Don R. Hansen, Maryanne M. MowenPublisher:Cengage Learning
 Essentials of Business Analytics (MindTap Course ...StatisticsISBN:9781305627734Author:Jeffrey D. Camm, James J. Cochran, Michael J. Fry, Jeffrey W. Ohlmann, David R. AndersonPublisher:Cengage Learning
Excel Applications for Accounting Principles
Accounting
ISBN:9781111581565
Author:Gaylord N. Smith
Publisher:Cengage Learning
Managerial Accounting: The Cornerstone of Busines...
Accounting
ISBN:9781337115773
Author:Maryanne M. Mowen, Don R. Hansen, Dan L. Heitger
Publisher:Cengage Learning
Financial And Managerial Accounting
Accounting
ISBN:9781337902663
Author:WARREN, Carl S.
Publisher:Cengage Learning,
Managerial Accounting
Accounting
ISBN:9781337912020
Author:Carl Warren, Ph.d. Cma William B. Tayler
Publisher:South-Western College Pub
Cornerstones of Cost Management (Cornerstones Ser...
Accounting
ISBN:9781305970663
Author:Don R. Hansen, Maryanne M. Mowen
Publisher:Cengage Learning
Essentials of Business Analytics (MindTap Course ...
Statistics
ISBN:9781305627734
Author:Jeffrey D. Camm, James J. Cochran, Michael J. Fry, Jeffrey W. Ohlmann, David R. Anderson
Publisher:Cengage Learning
What is variance analysis?; Author: Corporate finance institute;https://www.youtube.com/watch?v=SMTa1lZu7Qw;License: Standard YouTube License, CC-BY