Videos
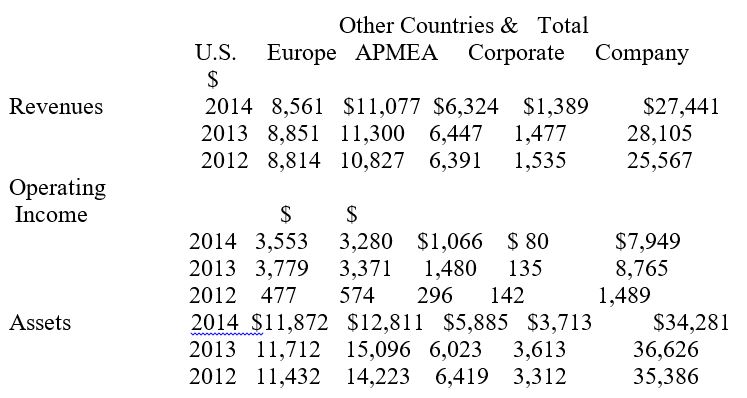
Case 10.14
LO 5
Calculate
Required:
a. Based on a cursory review of the data, can you identify any significant trends in the consolidated totals? Are there any notable trends in the data for specific business segments?
b. Using the DuPont model to show margin and turnover, calculate ROI for each of the three primary geographic segments for 2014. Round your percentage answers to one decimal place.
c. Looking only at the data presented here, which business segment appears to offer McDonald’s Corp, the greatest potential for high returns in the future?
d. Comment about the difficulties you may encounter when attempting to interpret the Other Countries and Corporate segment results.
e. Can you think of any ways in which McDonald’s could improve upon its classification of geographic segment data?
Want to see the full answer?
Check out a sample textbook solution


- Problem 13.21 Scorecard Measures, Strategy Translation Objective 2 - Discuss the basic features of the Balanced Scorecard.3 - Explain how the Balanced Scorecard links measures to strategy. At the end of 20x1, Mejorar Company implemented a low-cost strategy to improve its competitive position. Its objective was to become the low-cost producer in its industry. A Balanced Ung.cengage.com/statioinbluilevalndex.html?elSBN=97813059707248id=187456245&nbid=5245498snapshotid=5245498dockApplid=1. 1/10 2020 Print Preview Scorecard was developed to guide the company toward this objective. To lower costs, Mejorar undertook a number of improvement activities such as JIT production, total quality management, and activity-based management. Now, after two years of operation, the president of Mejorar wants some assessment of the achievements. To help provide this assessment, the following information on one product has been gathered: 20x1 20x3 Theoretical annual capacity* Actual production** Market size…arrow_forwardTo continue its plan for global growth, KFC must understand which of the following statements regarding global segmentation, targeting, and positioning is true? Multiple Choice O Global segmentation, targeting, and positioning activities are far less complicated than the same activities in the domestic market. Companies must continually adjust products and marketing strategies to meet the changing needs of global markets. When developing a global STP strategy. It is best to define segments by geography alone. 5:54 am ✓ Global segmentation, targeting, and positioning activities are far less complicated than the same activities in the domestic market. Companies must continually adjust products and marketing strategies to meet the changing needs of global markets When developing a global STP strategy, it is best to define segments by geography alone. The "golden rule" for global STP activities for firms is never to after a firm's marketing mix to serve the needs of global markets.…arrow_forwardConsider the following data and determine which of the corporate divisions is more profitable. Explain your reasoning. Domestic International Operating income $8,000,000 $ 11,000,000 Average total assets 20,000,000 32,000,000 C Begin by selecting the formula to calcula return on investment (ROI), and then enter the amounts to calculate each division's ROI. (Enter your answer as a percent rounded to one decimal place, X.X%) ROI % Domestic % International In terms of return on investment (ROI) the Division is more profitable becausearrow_forward
- Che 11 Tan Corporation of Japan has two regional divisions with headquarters in Osaka and Yokohama. Selected data on the two divisions follow: Division Osaka $ 9,600,000 Yokohama Sales Net operating income Average operating assets $ 26,000,000 672,000 $ 2,340,000 $ 3,200,000 $ $ 13,000,000 eBook Hint Required: 1. For each division, compute the return on investment (ROI) in terms of margin and turnover. 2. Assume that the company evaluates performance using residual income and that the minimum required rate of return for any division is 16%. Compute the residual income for each division. Print eferences Complete this question by entering your answers in the tabs below. Required 1 Required 2 For each division, compute the return on investment (ROI) in terms of margin and turnover. Osaka Yokohama RI K Required 1 Required 2 > raw %23 3r 5 U H.arrow_forwardExercise 11-13 (Algo) Transfer Pricing Situations [LO11-3] [The following information applies to the questions displayed below.] In each of the cases below, assume Division X has a product that can be sold either to outside customers or to Division Y of the same company for use in its production process. The managers of the divisions are evaluated based on their divisional profits. Case A B Division X: Capacity in units Number of units being sold to outside customers Selling price per unit to outside customers 95,000 95,000 96,000 79,000 $ 50 $ 30 Variable costs per unit Fixed costs per unit (based on capacity) Division Y: $ 28 $ 12 $ 6 $ 4 Number of units needed for production 17,000 17,000 Purchase price per unit now being paid to an outside supplier $ 43 $ 24 Exercise 11-13 (Algo) Part 2 Required: 2. Refer to the data in case B above. In this case, there will be no savings in variable selling costs on intracompany sales. a. What is the lowest acceptable transfer price from the…arrow_forwardSelected sales and operating data for three divisions of a multinational structural engineering firm are provided below: Sales Average operating assets Net operating income Minimum required rate of return Required: 1. Compute the ROI for each division using the formula stated in terms of margin and turnover. 2. Compute the RI for each division. Asia $12,000,000 $3,000,000 $ 420,000 14% Division Europe $14,000,000 $ 5,000,000 $ 400,000 10% North America $25,000,000 $10,000,000 $ 1.000.000 16%arrow_forward
- QUESTION 2 Ayittey Ltd is an organization with two divisions: A and B, each with its own cost and revenue streams. Each of the two divisions is classified as Investment center. The company’s cost of capital is 9%. Historically, investment decisions have been made by calculating the return on investment (ROI). A new manager who has recently been appointed in division A has argued that using residual income (RI) to make investment decisions would result in ‘better goal congruence’ throughout the company. The data below shows the current position of the division as at the end of 31 December, 2019: Details of Projects Project A Project B Capital required GH¢ 82.8 million GH¢ 40.6 million Sales generated GH¢44.6 million GH¢ 21.8 million Net Profit margin 18% 25% The company is seeking to maximize shareholders wealth. Assuming that, Division A acquires a more efficient asset at GH¢17 million and Division B sold one of its assets with written down value of GH¢21 million, and profits are…arrow_forwardS Meiji Isetan Corporation of Japan has two regional divisions with headquarters in Osaka and Yokohama. Selected data on the two divisions follow Sales Net operating income Average operating assets Required 1 Required 2 Required: 1. For each division, compute the return on investment (ROI) in terms of margin and turnover. 2. Assume that the company evaluates performance using residual income and that the minimum required rate of return for any division is 17%. Compute the residual income for each division. 3. Is Yokohama's greater amount of residual income an indication that it is better managed? Osaka $ 9,900,000 $ 792,000 $ 2,475,000 Complete this question by entering your answers in the tabs below. ROI % Division Required 3 For each division, compute the return on investment (ROI) in terms of margin and turnover. Osaka Yokohama $ 29,000,000 $ 2,900,000 $ 14,500,000 Yokohama %arrow_forwardExercise 11-13 (Algo) Transfer Pricing Situations [LO11-3] Skip to question [The following information applies to the questions displayed below.] In each of the cases below, assume Division X has a product that can be sold either to outside customers or to Division Y of the same company for use in its production process. The managers of the divisions are evaluated based on their divisional profits. Case A B Division X: Capacity in units 100,000 95,000 Number of units being sold to outside customers 100,000 74,000 Selling price per unit to outside customers $ 55 $ 30 Variable costs per unit $ 26 $ 14 Fixed costs per unit (based on capacity) $ 7 $ 5 Division Y: Number of units needed for production 21,000 21,000 Purchase price per unit now being paid to an outside supplier $ 50 $ 28 Exercise 11-13 (Algo) Part 1 Required: 1. Refer to the data in case A above. Assume in this case that $3 per unit in variable selling costs can be avoided on…arrow_forward
- 12 & 14 Recap Saved Help Save Required information [The following information applies to the questions displayed below.] In each of the cases below, assume Division X has a product that can be sold either to outside customers or to Division Y of the same company for use in its production process. The managers of the divisions are evaluated based on their divisional profits. Case Division X: Capacity in units Number of units being sold to outside customers Selling price per unit to outside customers Variable costs per unit Fixed costs per unit (based on capacity) Division Y: 103,000 103,000 95,000 77,000 59 $ 29 $ 10 $ 29 %2$ 15 5 Number of units needed for production Purchase price per unit now being paid to an outside supplier 18,000 18,000 53 $ 30 Required: 2. Refer to the data in case B above. In this case, there will be no savings in variable selling costs on intracompany sales. a. What is the lowest acceptable transfer price from the perspective of the selling division? b. What is…arrow_forwardExercise 14-32 (Algo) Comparing Business Units Using Residual Income (LO 14-3) Lauderdale Corporation is organized in three geographical divisions (regions) with managers responsible for revenues, costs, and assets in their respective regions. The firm is highly decentralized and managers are evaluated solely on divisional performance. Corporate overhead (all fixed) is allocated to the regions based on regional gross margin (regional revenue minus regional cost of sales). The following information is from Lauderdale's first year of operations: Revenues Cost of sales Selling, General and Administrative (all fixed) Corporate overhead Region I $ 1,218,000 459,000 447,000 Region II $ 1,680,000 Region III 819,000 657,000 $ 2,268,000 1,149,000 877,000 Total Corporation $ 5,166,000 2,427,000 1,981,000 Information on the division assets in the three regions of Lauderdale Corporation follows: Region I Region II Region III $ 718,000 648,000 1,314,500 Lauderdale Corporation has a cost of capital…arrow_forwardQ7 Consider the following data from two divisions of a company, P and Q: Divisional P Q Sales $ 1,500,000 $ 1,000,000 Operating Income $ 600,000 $ 450,000 Investment $ 4,000,000 $ 2,750,000 If both divisions were presented with an opportunity to invest in a project that is estimated to achieve an ROI of 15%, what will the units likely decide? Multiple Choice Division P will not invest; Division Q will invest. Division P will invest; Division Q will not invest. Neither unit will invest in the projects. Division P will be indifferent; Division Q will not invest. Division P will invest; Division Q will be indifferent.arrow_forward
 Survey of Accounting (Accounting I)AccountingISBN:9781305961883Author:Carl WarrenPublisher:Cengage Learning