
APPLIED STAT.IN BUS.+ECONOMICS
6th Edition
ISBN: 9781259957598
Author: DOANE
Publisher: RENT MCG
expand_more
expand_more
format_list_bulleted
Concept explainers
Videos
Textbook Question
Chapter 1, Problem 28CE
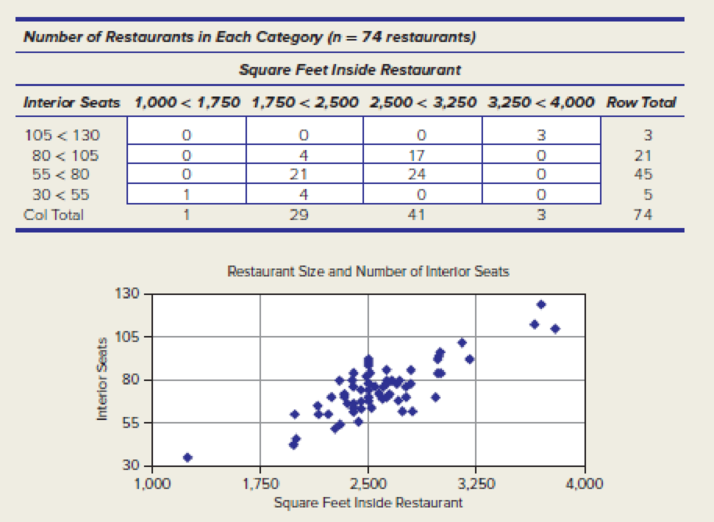
- (a) Which of these two displays (table or graph) is more helpful in visualizing the relationship
- (b) between restaurant size and interior seating for 74 Noodles restaurants? Explain your reasoning, (b) Do you see anything unusual in the data? (Source: Noodles & Company) NoodlesSqFt
Expert Solution & Answer
Want to see the full answer?
Check out a sample textbook solution
Chapter 1 Solutions
APPLIED STAT.IN BUS.+ECONOMICS
Ch. 1.3 - Give an example of how statistics might be useful...Ch. 1.3 - Give an example of how statistics might be useful...Ch. 1.3 - (a) Should the average business school graduate...Ch. 1.3 - Many college graduates will not use very much...Ch. 1.5 - Recently, the same five winning numbers (4, 21,...Ch. 1.5 - A National Health Interview Survey conducted by...Ch. 1.5 - A study found that radar detector users have lower...Ch. 1.5 - A lottery winner told how he picked his six-digit...Ch. 1.5 - Smokers are much more likely to speed, run red...Ch. 1.5 - An ad for a cell phone service claims that its...
Ch. 1.5 - What logical or ethical problems do you see in...Ch. 1.5 - A recent study of 231,164 New Jersey heart attack...Ch. 1.5 - When Pennsylvania repealed a law that required...Ch. 1 - Define (a) statistic; (b) statistics.Ch. 1 - List three reasons to study statistics.Ch. 1 - List three applications of statistics.Ch. 1 - List four skills needed by statisticians. Why are...Ch. 1 - List three practical challenges faced by...Ch. 1 - List three ethical challenges faced by...Ch. 1 - List five pitfalls or logical errors that may...Ch. 1 - A survey of beginning students showed that a...Ch. 1 - Under a recent U.S. Food and Drug Administration...Ch. 1 - A statistical consultant was retained by a linen...Ch. 1 - Ergonomics is the science of making sure that...Ch. 1 - Analysis of 1,064 deaths of famous popular...Ch. 1 - A recent study showed that women who lived near a...Ch. 1 - Lacrosse helmets are not needed, said Tom. None of...Ch. 1 - A European study of thousands of men found that...Ch. 1 - A research study showed that 7 percent of A...Ch. 1 - A research study showed that adolescents who...Ch. 1 - The Graduate Management Admission Test (GMAT) is...Ch. 1 - (a) Which of these two displays (table or graph)...Ch. 1 - (a) Which of these two displays (table or graph)...
Knowledge Booster


Learn more about
Need a deep-dive on the concept behind this application? Look no further. Learn more about this topic, statistics and related others by exploring similar questions and additional content below.Recommended textbooks for you
 Glencoe Algebra 1, Student Edition, 9780079039897...AlgebraISBN:9780079039897Author:CarterPublisher:McGraw Hill
 Big Ideas Math A Bridge To Success Algebra 1: Stu...AlgebraISBN:9781680331141Author:HOUGHTON MIFFLIN HARCOURTPublisher:Houghton Mifflin Harcourt
Glencoe Algebra 1, Student Edition, 9780079039897...
Algebra
ISBN:9780079039897
Author:Carter
Publisher:McGraw Hill
Big Ideas Math A Bridge To Success Algebra 1: Stu...
Algebra
ISBN:9781680331141
Author:HOUGHTON MIFFLIN HARCOURT
Publisher:Houghton Mifflin Harcourt
The Shape of Data: Distributions: Crash Course Statistics #7; Author: CrashCourse;https://www.youtube.com/watch?v=bPFNxD3Yg6U;License: Standard YouTube License, CC-BY
Shape, Center, and Spread - Module 20.2 (Part 1); Author: Mrmathblog;https://www.youtube.com/watch?v=COaid7O_Gag;License: Standard YouTube License, CC-BY
Shape, Center and Spread; Author: Emily Murdock;https://www.youtube.com/watch?v=_YyW0DSCzpM;License: Standard Youtube License