Financial Accounting: The Impact on Decision Makers
10th Edition
ISBN: 9781305654174
Author: Gary A. Porter, Curtis L. Norton
Publisher: Cengage Learning
expand_more
expand_more
format_list_bulleted
Textbook Question
Chapter 1, Problem 1.9E
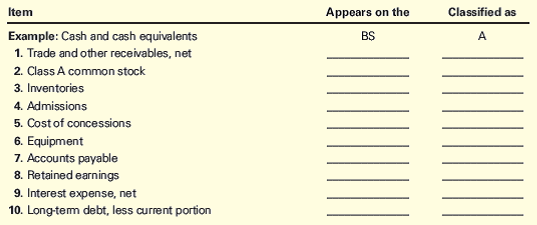
Classification of Financial Statement Items
Regal Entertainment Group operates the largest chain of movie theaters in the U.S. Classify each of the following items found in the company’s financial statements included in the Form 10-K for the year ended January 1, 2015, according to (1) whether it belongs on the income statement (IS) or
Expert Solution & Answer
Trending nowThis is a popular solution!
Students have asked these similar questions
Identifying and Classifying Balance Sheet and Income Statement Accounts
Following are selected accounts for Target Corporation.
(a) Indicate whether each account appears on the balance sheet (B) or income statement (I).
($ millions)
Amount Classification
$61,471
Sales
Accumulated depreciation
Retained earnings
Depreciation expense
Net income
7,887
12,761
1,659
2,849
Property, plant & equipment, net
24,095
Selling, general & administrative expense 13,704
Accounts receivable
8,054
Total liabilities
29,253
Stockholders' equity
15,307
45
◆
46
⇓⇓⇓
◆
◆
4
4
(b) Using the data, compute total assets and total expenses.
Total Assets |= $
Total Expenses = $
ll.
Liverton Co.’s income statement for the year ended 31 March 2019 and statements of financial position at 31 March 2019 and 2018 were as follows in the images.
Calculate for the financial year ended 31 March 2019 and, where possible, for 31 March 2018, the following ratios:
i) Gross profit marginii) Assets usageiii) Current ratioiv) Acid testv) Inventories holding periodvi) Debt to Equity ratio
Chapter 1 Solutions
Financial Accounting: The Impact on Decision Makers
Ch. 1 - Prob. 1.1KTQCh. 1 - Prob. 1.1ECh. 1 - Prob. 1.2ECh. 1 - The Accounting Equation For each of the following...Ch. 1 - The Accounting Equation Ginger Enterprises began...Ch. 1 - The Accounting Equation Using the accounting...Ch. 1 - Changes in Owners Equity The following amounts are...Ch. 1 - The Accounting Equation For each of the following...Ch. 1 - Classification of Financial Statement Items...Ch. 1 - Classification of Financial Statement Items Regal...
Ch. 1 - Net Income (or Loss) and Retained Earnings The...Ch. 1 - Statement of Retained Earnings Ace Corporation has...Ch. 1 - Accounting Principles and Assumptions The...Ch. 1 - Prob. 1.13ECh. 1 - Prob. 1.14ECh. 1 - Prob. 1.15MCECh. 1 - Prob. 1.16MCECh. 1 - Prob. 1.1PCh. 1 - Users of Accounting Information and Their Needs...Ch. 1 - Prob. 1.3PCh. 1 - Prob. 1.4PCh. 1 - Income Statement, Statement of Retained Earnings,...Ch. 1 - Income Statement and Balance Sheet Green Bay...Ch. 1 - Prob. 1.7PCh. 1 - Statement of Retained Earnings for The Coca-Cola...Ch. 1 - Prob. 1.9PCh. 1 - Prob. 1.10MCPCh. 1 - Prob. 1.1APCh. 1 - Users of Accounting Information and Their Needs...Ch. 1 - Prob. 1.3APCh. 1 - Prob. 1.4APCh. 1 - Income Statement, Statement of Retained Earnings,...Ch. 1 - Income Statement and Balance Sheet Fort Worth...Ch. 1 - Corrected Financial Statements Heidis Bakery Inc....Ch. 1 - Statement of Retained Earnings for Brunswick...Ch. 1 - Prob. 1.9APCh. 1 - Prob. 1.10AMCPCh. 1 - Prob. 1.1DCCh. 1 - Reading and Interpreting Chipotles Financial...Ch. 1 - Comparing Two Companies in the Same Industry:...Ch. 1 - Prob. 1.5DCCh. 1 - Prob. 1.6DCCh. 1 - Prob. 1.7DC
Knowledge Booster
Learn more about
Need a deep-dive on the concept behind this application? Look no further. Learn more about this topic, accounting and related others by exploring similar questions and additional content below.Similar questions
- Financial statement analysis The financial statements for Nike, Inc., are presented in Appendix D at the end of the text. Use the following additional information (in thousands): Instructions 1. Determine the following measures for the fiscal years ended May 31, 2016, and May 31, 2015. Round ratios and percentages to one decimal place. a. Working capital b. Current ratio c. Quick ratio d. Accounts receivable turnover e. Number of days sales in receivables f. Inventory turnover g. Number of days sales in inventory h. Ratio of liabilities to stockholders equity i. Asset turnover j. Return on total assets. k. Return on common stockholders equity l. Price-earnings ratio, assuming that the market price was 54.90 per share on May 29, 2016, and 52.81 per share on May 30, 2015 m. Percentage relationship of net income to sales 2. What conclusions can be drawn from these analyses?arrow_forwardSubject : Accountingarrow_forwardPlease help me with show all calculation thankuarrow_forward
- Consider the comparative balance sheet and income statement for Starbucks provided in the shown Figures . Based on these financial statements, determine the following for the year September 30, 2018: Solve, a. Return on assets employed. b. Return on owner’s equity. c. Current ratio.arrow_forwardUse the information provided from Sapphire Ltd calculate and comment on the following ratios:1. Profit margin2. Return on equityarrow_forwardWhat amount of total assets does the company report on its balance sheet? What amount of total liabilities does the company report on its balance sheet?arrow_forward
- The following financial statements apply to Adams Company: ADAMS COMPANY Income Statements for the Years Ending December 31 Year 1 $180,400 Revenues Expenses Cost of goods sold Selling expenses General and administrative expenses Interest expense Income tax expense Total expenses Net income Assets Current assets Cash Marketable securities Accounts receivable Inventories Prepaid expenses Total current assets Plant and equipment (net) Intangibles Total assets Liabilities and Stockholders Equity Liabilities Current liabilities Accounts payable Other Total current liabilities Bonds payable Total liabilities $ 220,800 Stockholders equity Common stock (49,000 shares) 124, 600 20,200 10,000 2.100 20,400 177,300 $ 43,500 ADAMS COMPANY Balance Sheets As of December 31 F Retained earnings Total stockholders equity Total liabilities and stockholders' equity 102, 100 18.200 9,000 2,100 17,600 149,000 $ 31,400 $ 5,100 1,800 36,000 101, 200 4,800 148,900 107,000 20,600 $ 276,500 $38,200 16,500…arrow_forwardREQUIRED Use the information provided below to calculate the ratios for 2021 (expressed to two decimal places) that would reflect each of the following: The time taken by the company to settle its debts with trade suppliers The amount of debt that the company uses to finance its assets The operational effectiveness of the company before considering interest income,interest expense and company tax. What investors are willing to pay for the shares of the company with due considerationgiven to the profit generated by each share in the company. Comment on the FIVE (5) ratios of Oslo Limited as compared to the industry average provided in the additional information. INFORMATION The information given below was extracted from the books of Oslo Limited: OSLO LIMITED STATEMENT OF COMPREHENSIVE…arrow_forwardCalculate the following ratios from the income statement and balance sheet all are required 1-Equity Turnover 2-Gross Profit Margin 3-Operating Profit Margin 4-Net Profit Margin 5-ROA 6- ROE Statement of financial position as at 31 December 2018 2018 2017 Note RO RO ASSETS Non-current assets Property, plant and equipment 14 8,407,572 9,300,442 Deferred tax assets 12 40,977 18,550 8,448,549 9,318,992 Current assets Inventories 15 430,885 422,421 Trade and other receivables 16 1,129,440 1,235,724 Due from related parties 24 70,300 73,050 Cash and bank balances 17 6,856,734 6,439,709 Total current assets 8,487,359 8,170,904 Total assets 16,935,908 17,489,896 EQUITY…arrow_forward
- Ch: Analyzing Financial Statements The current year financial statement for sand and Juffair companies are presented below. Balance sheet at 31 Dec 2019 Item Cash Account receivable (net) Inventory Property & equipment (net) Other assets Total assets Current liabilities Long-term debt (interest rate: 10%) Capital stock ($10 par value) Additional paid-in capital Retained earnings Total liabilities and stockholders' equity Income statement at 31 Dec 2019 item Sales revenue (1/3 on credit) (-) Cost of goods sold (-) Operating expenses Net income Other data item Per share stock price at end of current year Average income tax rate Dividends declared and paid in current year Sand 45000 45000 95000 160000 90000 435000 95000 75000 155000 40000 70000 435000 Sand 440000 230000 159000 51000 Sand 23 30% 34000 Juffair 22000 35000 45000 415000 320000 837000 65000 65000 522000 110000 75000 837000 Juffair 800000 399000 315000 86000 Juffair 25 30% 153000 Both companies are in the fish catching and…arrow_forward[The following information applies to the questions displayed below.] Selected comparative financial statements of Korbin Company follow. KORBIN COMPANY Comparative Income Statements For Years Ended December 31 Sales. Cost of goods sold Gross profit Selling expenses Administrative expenses Total expenses Income before taxes Income tax expense Net income Assets Current assets Long-term investments. Plant assets, net Total assets Liabilities and Equity Current liabilities KORBIN COMPANY Comparative Balance Sheets 2020 2021 $548,688 $ 420,340 330,310 263,974 218,378 156,366 77,914 58,007 49,382 36,990 127,296 94,997 91,082 61,369 16,941 12,581 $ 74,141 $ 48,788 Common stock Other paid-in capital Retained earnings Sales Cost of goods sold Gross profit Selling expenses Administrative expenses Total expenses Income before taxes Income tax expense Net income December 31 2021 $ 62,574 % 0 % $ 41,881 $ 55,985 1,200 3,920 114,438 103,962 61,920 $177,012 $ 147,043 $ 121,825 $ 25,844 65,000 8,125…arrow_forwardReal-world annual report The financial statements for Nike, Inc. (NKE), are presented in Appendix E at the end of the text. The following additional information is available (in thousands): Instructions 1. Determine the following measures for the fiscal years ended May 31, 2017, and May 31, 2016. Round ratios and percentages to one decimal place. a. Working capital b. Current ratio c. Quick ratio d. Accounts receivable turnover e. Number of days sales in receivables f. Inventory turnover g. Number of days sales in inventory' h. Ratio of liabilities to stockholders equity i. Asset turnover j. Return on total assets, assuming interest expense is 82 million for the year ending May 31. 2017, and 33 million for the year ending May 31, 2016. k. k. Return on common stockholders equity l. Price-eamings ratio, assuming that the market price was 52.81 per share on May 31, 2017, and 54.35 per share on May 31, 2016. m. m. Percentage relationship of net income to sales 2. What conclusions can be drawn from these analyses?arrow_forward
arrow_back_ios
SEE MORE QUESTIONS
arrow_forward_ios
Recommended textbooks for you
- Financial Accounting: The Impact on Decision Make...AccountingISBN:9781305654174Author:Gary A. Porter, Curtis L. NortonPublisher:Cengage LearningCornerstones of Financial AccountingAccountingISBN:9781337690881Author:Jay Rich, Jeff JonesPublisher:Cengage LearningManagerial Accounting: The Cornerstone of Busines...AccountingISBN:9781337115773Author:Maryanne M. Mowen, Don R. Hansen, Dan L. HeitgerPublisher:Cengage Learning
- Financial AccountingAccountingISBN:9781337272124Author:Carl Warren, James M. Reeve, Jonathan DuchacPublisher:Cengage LearningManagerial AccountingAccountingISBN:9781337912020Author:Carl Warren, Ph.d. Cma William B. TaylerPublisher:South-Western College PubFinancial And Managerial AccountingAccountingISBN:9781337902663Author:WARREN, Carl S.Publisher:Cengage Learning,
Financial Accounting: The Impact on Decision Make...
Accounting
ISBN:9781305654174
Author:Gary A. Porter, Curtis L. Norton
Publisher:Cengage Learning
Cornerstones of Financial Accounting
Accounting
ISBN:9781337690881
Author:Jay Rich, Jeff Jones
Publisher:Cengage Learning
Managerial Accounting: The Cornerstone of Busines...
Accounting
ISBN:9781337115773
Author:Maryanne M. Mowen, Don R. Hansen, Dan L. Heitger
Publisher:Cengage Learning
Financial Accounting
Accounting
ISBN:9781337272124
Author:Carl Warren, James M. Reeve, Jonathan Duchac
Publisher:Cengage Learning
Managerial Accounting
Accounting
ISBN:9781337912020
Author:Carl Warren, Ph.d. Cma William B. Tayler
Publisher:South-Western College Pub
Financial And Managerial Accounting
Accounting
ISBN:9781337902663
Author:WARREN, Carl S.
Publisher:Cengage Learning,
IAS 29 Financial Reporting in Hyperinflationary Economies: Summary 2021; Author: Silvia of CPDbox;https://www.youtube.com/watch?v=55luVuTYLY8;License: Standard Youtube License