
EBK STATISTICS FOR BUSINESS & ECONOMICS
12th Edition
ISBN: 8220100460463
Author: Anderson
Publisher: CENGAGE L
expand_more
expand_more
format_list_bulleted
Concept explainers
Videos
Textbook Question
Chapter 1, Problem 15SE
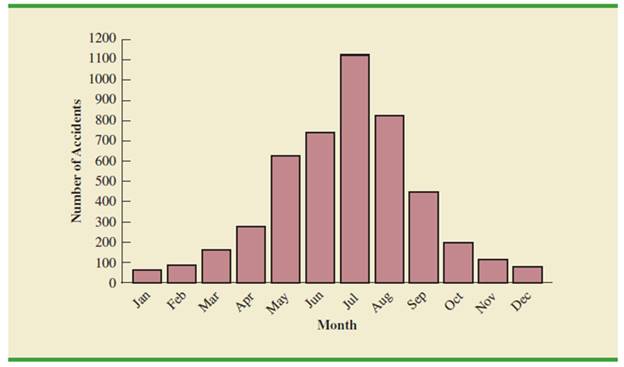
Every year, the U.S. Coast Guard collects data and compiles statistics on reported recreational boating accidents. These statistics are derived from accident reports that are filed by the owners/operators of recreational vessels involved in accidents. In 2009, 4730 recreational boating accident reports were filed. Figure 1.8 provides a bar chart summarizing the number of accident reports that were filed each month (U.S. Coast Guard’s Boating Safety Division website, August 2010).
- a. Are the data categorical or quantitative?
- b. Are the data time series or cross-sectional?
- c. In what month were the most accident reports filed? Approximately how many?
- d. There were 61 accident reports filed in January and 76 accident reports filed in December. What percentage of the total number of accident reports for the year were filed in these two months? Does this seem reasonable?
- e. Comment on the overall shape of the bar graph.
FIGURE 1.8 NUMBER OF RECREATIONAL BOATING ACCIDENTS
Expert Solution & Answer

Trending nowThis is a popular solution!

Chapter 1 Solutions
EBK STATISTICS FOR BUSINESS & ECONOMICS
Ch. 1 - Discuss the differences between statistics as...Ch. 1 - The U.S. Department of Energy provides fuel...Ch. 1 - Refer to Table 1.6. a. What is the average miles...Ch. 1 - Table 1.7 shows data for seven colleges and...Ch. 1 - Consider the data set in Table 1.7 a. Compute the...Ch. 1 - Foreign Affairs magazine conducted a survey to...Ch. 1 - The Kroger Company is one of the largest grocery...Ch. 1 - The FinancialTimes/Harris Poll is a monthly online...Ch. 1 - The Commerce Department reported receiving the...Ch. 1 - The Bureau of Transportation Statistics Omnibus...
Ch. 1 - J.D. Power and Associates conducts vehicle quality...Ch. 1 - The Hawaii Visitors Bureau collects data on...Ch. 1 - Figure 1.8 provides a bar chart showing the amount...Ch. 1 - The following data show the number of rental cars...Ch. 1 - Every year, the U.S. Coast Guard collects data and...Ch. 1 - A manager of a large corporation recommends a...Ch. 1 - A random telephone survey of 1021 adults (aged 18...Ch. 1 - A Bloomberg Businessweek North American subscriber...Ch. 1 - A survey of 131 investment managers in Barrons Big...Ch. 1 - A seven-year medical research study reported that...Ch. 1 - The Nielsen Company surveyed consumers in 47...Ch. 1 - Pew Research Center is a nonpartisan polling...Ch. 1 - A sample of midterm grades for five students...Ch. 1 - Table 1.8 shows a data set containing information...
Knowledge Booster


Learn more about
Need a deep-dive on the concept behind this application? Look no further. Learn more about this topic, statistics and related others by exploring similar questions and additional content below.Recommended textbooks for you
 Glencoe Algebra 1, Student Edition, 9780079039897...AlgebraISBN:9780079039897Author:CarterPublisher:McGraw Hill
 Holt Mcdougal Larson Pre-algebra: Student Edition...AlgebraISBN:9780547587776Author:HOLT MCDOUGALPublisher:HOLT MCDOUGAL
 Algebra: Structure And Method, Book 1AlgebraISBN:9780395977224Author:Richard G. Brown, Mary P. Dolciani, Robert H. Sorgenfrey, William L. ColePublisher:McDougal Littell
Glencoe Algebra 1, Student Edition, 9780079039897...
Algebra
ISBN:9780079039897
Author:Carter
Publisher:McGraw Hill
Holt Mcdougal Larson Pre-algebra: Student Edition...
Algebra
ISBN:9780547587776
Author:HOLT MCDOUGAL
Publisher:HOLT MCDOUGAL
Algebra: Structure And Method, Book 1
Algebra
ISBN:9780395977224
Author:Richard G. Brown, Mary P. Dolciani, Robert H. Sorgenfrey, William L. Cole
Publisher:McDougal Littell
The Shape of Data: Distributions: Crash Course Statistics #7; Author: CrashCourse;https://www.youtube.com/watch?v=bPFNxD3Yg6U;License: Standard YouTube License, CC-BY
Shape, Center, and Spread - Module 20.2 (Part 1); Author: Mrmathblog;https://www.youtube.com/watch?v=COaid7O_Gag;License: Standard YouTube License, CC-BY
Shape, Center and Spread; Author: Emily Murdock;https://www.youtube.com/watch?v=_YyW0DSCzpM;License: Standard Youtube License