
MATLAB: An Introduction with Applications
6th Edition
ISBN: 9781119256830
Author: Amos Gilat
Publisher: John Wiley & Sons Inc
expand_more
expand_more
format_list_bulleted
Related questions
Question
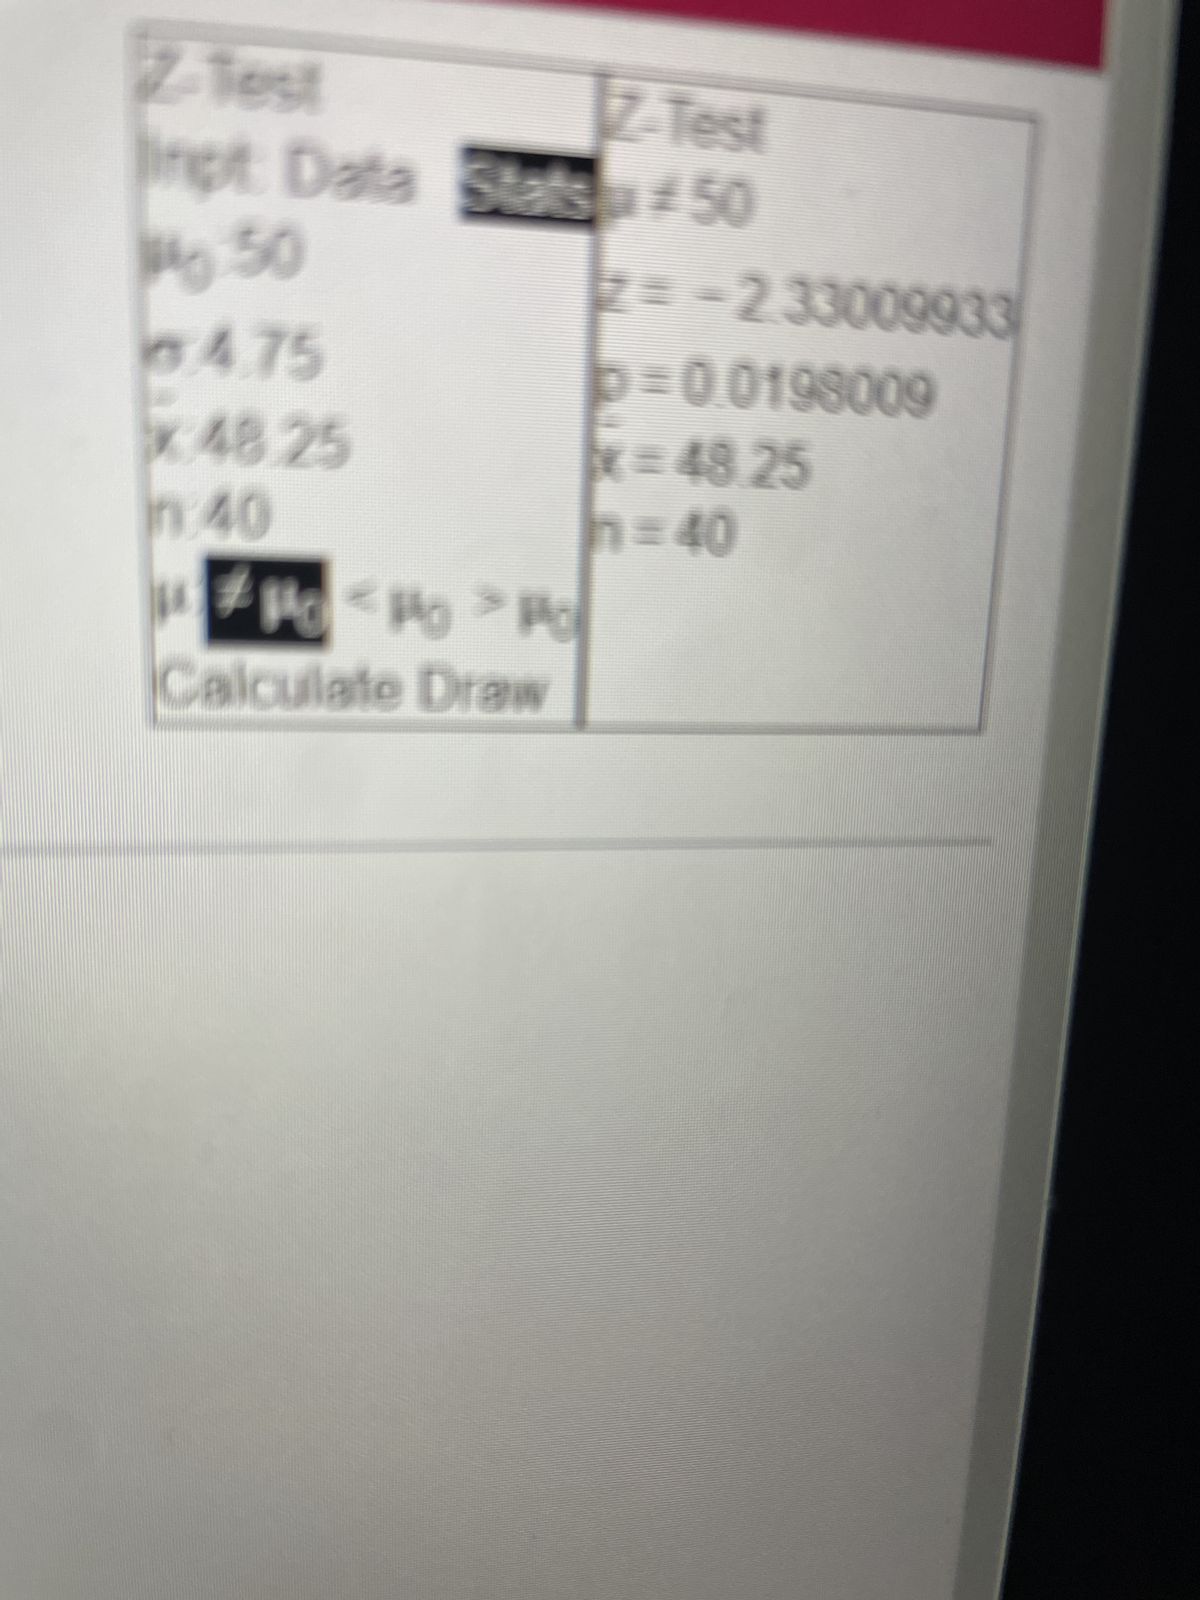

Transcribed Image Text:The image contains information related to a Z-Test, which is a statistical method used to determine if there is a significant difference between sample data and a population. Here is the transcription and explanation of the elements present:
**Z-Test Input Data**
- **μ0**: 50
- **σ (sigma)**: 4.75
- **x̄ (x-bar)**: 48.25
- **n**: 40
The input data section provides the following:
- **μ0 (Mu zero)**: Hypothesized population mean
- **σ (sigma)**: Sample standard deviation
- **x̄ (x-bar)**: Sample mean
- **n**: Sample size
**Z-Test Results**
- **Z**: -2.33000933
- **p**: 0.0198009
- **x̄ (x-bar)**: 48.25
- **n**: 40
The results section presents:
- **Z**: The calculated Z-score, which measures how many standard deviations the sample mean is from the hypothesized population mean.
- **p**: The p-value, which helps determine the significance of the results. A lower p-value (typically ≤ 0.05) indicates strong evidence against the null hypothesis.
**Hypotheses Tested**
- The image suggests two possible tests:
- **H1: μ0 < μc**
- **H2: μ0 > μc**
This represents the alternative hypotheses indicating whether the population mean is less than or greater than the hypothesized mean, respectively.
**Button**
- **Calculate Draw**
There appears to be a button labeled "Calculate Draw," likely used to execute the test and visualize the results.
**Graphs/Diagrams**
There are no graphs or diagrams visible to describe. The focus is on the statistical data and results presented.

Transcribed Image Text:**Text Transcription:**
Use the calculator displays to the right to make a decision to reject or fail to reject the null hypothesis at a significance level of α = 0.01.
Choose the correct answer below.
- O A. Since the P-value is less than α, reject the null hypothesis.
- O B. Since the P-value is less than α, fail to reject the null hypothesis.
- O C. Since the P-value is greater than α, reject the null hypothesis.
- O D. Since the P-value is greater than α, fail to reject the null hypothesis.
**Explanation of Graphs/Diagrams:**
The image does not contain any graphs or diagrams that require detailed explanation.
Expert Solution
This question has been solved!
Explore an expertly crafted, step-by-step solution for a thorough understanding of key concepts.

Step by stepSolved in 2 steps

Knowledge Booster

Similar questions
- compute the z score for a raw score of 125, which is (125-100)/10, or +2.5arrow_forwardWhat are the two frequencies measured during the Chi-Square Goodness of Fit test and what is the difference between the two?arrow_forwardA random sample of n = 160 measurements was selected from a population with unknown mean and known standard deviation = 15. Calculate interval for unknown mean where the point estimate X=68arrow_forward
- O Assighmant Score! < Question 12 of 16 Of the many species of oak trees in the United States, 28 grow on the Atlantic Coast and 11 grow in California. The back-to-back stemplot displays data on the average volume of acorns (in cubic centimeters) for these 39 oak species. Atlantie Const 998643 0 | Callifornia Which of the following are correct comparisons of the 4. 88864211111 1 50 2 6640 3 06 06 distributions of acorn volumes for the Atlantic Coast and California? 8 4 1 5 86 I. Both distributions have similar variability. II. Both distributions have similar medians. 59 1 8 1 9 10 11 III. Both distributions have possible outliers. O I and III only Key: 26 = An oak species whose acorn volume is 2.6 cm. O II and III only 15 16 17 O II only O I only O III only 1 From the Electronic Encyclopedia of Statistics Examples and Exercises (EESEE) story "Acorn Size and Oak Tree Range."arrow_forward13. Two tail test with t-calc = 1.831 and degrees of freedom = 48. p-value of the test is: a) 0.05 < p-value < 0.1 b) 0.1 < p-value < 0.2 c) 0.01 < p-value < 0.02 d) 0.02 < p-value < 0.05arrow_forwardM means medianarrow_forward
- A previous study showed to determine whether a sales tax on soda will reduce consumption of soda in the US below the current per-capita level of about 50 gallons of soda per year. Hypotheses Test is Ho: m(mue) =50 vs. Ha: m<50 where m (mue) represents the average annual consumption of soda in communities where the sales tax is implemented. (b) Now supposed sample results give a p-value of 0.41. Interpret this p-value in terms of random chance and in the context of taxes and soda consumption.arrow_forwardBuild a flow chart to show how to choose 5 cases in interval estimate for different between two population meanarrow_forwardd,e,f e) This result would be (usual, unusual) so the sample likely came from a population whose mean gestation period is(less, more, equal) to 266 daysarrow_forward
- Use the information given in the table below to find a 95% Prediction Interval for y when x = 10. n = 20 x_bar = 15 %3D beta0_hat = 53 SSXX = 62 beta1_hat = - 4.5 S = 9 (- 14.79, 30.79) (-0.57, 16.57) (-10.25, 26.25) O (- 4.73, 20.73)arrow_forwardCan i get help with this problem? the sample proportion denoted phat is given by the formula phat(p-hat)=x/n where x s the number of individuals with a specified characteristic in a sample of n individuals. 1. find: phat(p-hat_ if the students poll surveyed 1200 people that vacation during the summer and asked if they plan to work while on vacation. Of those surveyed, 552 indicated that they plan to work on vacation. Find the sample proportion of individuals polled that plan to work on vacation. So, Students estimates that from the value of phat(p-hat) found above that ____________ or ________ % of adults who vacation plan to work on vacation,arrow_forwardAn excess of high values for the cases distributed on a graph results in a positive skew in the data?arrow_forward
arrow_back_ios
SEE MORE QUESTIONS
arrow_forward_ios
Recommended textbooks for you
- MATLAB: An Introduction with ApplicationsStatisticsISBN:9781119256830Author:Amos GilatPublisher:John Wiley & Sons Inc
 Probability and Statistics for Engineering and th...StatisticsISBN:9781305251809Author:Jay L. DevorePublisher:Cengage Learning
 Statistics for The Behavioral Sciences (MindTap C...StatisticsISBN:9781305504912Author:Frederick J Gravetter, Larry B. WallnauPublisher:Cengage Learning
  Elementary Statistics: Picturing the World (7th E...StatisticsISBN:9780134683416Author:Ron Larson, Betsy FarberPublisher:PEARSON
 The Basic Practice of StatisticsStatisticsISBN:9781319042578Author:David S. Moore, William I. Notz, Michael A. FlignerPublisher:W. H. Freeman
 Introduction to the Practice of StatisticsStatisticsISBN:9781319013387Author:David S. Moore, George P. McCabe, Bruce A. CraigPublisher:W. H. Freeman
MATLAB: An Introduction with Applications
Statistics
ISBN:9781119256830
Author:Amos Gilat
Publisher:John Wiley & Sons Inc
Probability and Statistics for Engineering and th...
Statistics
ISBN:9781305251809
Author:Jay L. Devore
Publisher:Cengage Learning
Statistics for The Behavioral Sciences (MindTap C...
Statistics
ISBN:9781305504912
Author:Frederick J Gravetter, Larry B. Wallnau
Publisher:Cengage Learning
Elementary Statistics: Picturing the World (7th E...
Statistics
ISBN:9780134683416
Author:Ron Larson, Betsy Farber
Publisher:PEARSON
The Basic Practice of Statistics
Statistics
ISBN:9781319042578
Author:David S. Moore, William I. Notz, Michael A. Fligner
Publisher:W. H. Freeman
Introduction to the Practice of Statistics
Statistics
ISBN:9781319013387
Author:David S. Moore, George P. McCabe, Bruce A. Craig
Publisher:W. H. Freeman