MATLAB: An Introduction with Applications
6th Edition
ISBN: 9781119256830
Author: Amos Gilat
Publisher: John Wiley & Sons Inc
expand_more
expand_more
format_list_bulleted
Topic Video
Question

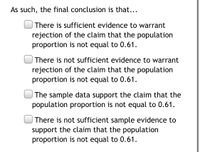
Transcribed Image Text:As such, the final conclusion is that...
There is sufficient evidence to warrant
rejection of the claim that the population
proportion is not equal to 0.61.
There is not sufficient evidence to warrant
rejection of the claim that the population
proportion is not equal to 0.61.
The sample data support the claim that the
population proportion is not equal to 0.61.
There is not sufficient sample evidence to
support the claim that the population
proportion is not equal to 0.61.

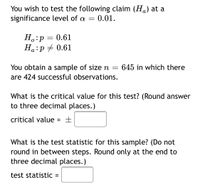
Transcribed Image Text:You wish to test the following claim (H) at a
significance level of a = 0.01.
H.:p = 0.61
Ha:p + 0.61
You obtain a sample of sizen = 645 in which there
are 424 successful observations.
What is the critical value for this test? (Round answer
to three decimal places.)
critical value = ±
%3D
What is the test statistic for this sample? (Do not
round in between steps. Round only at the end to
three decimal places.)
test statistic
Expert Solution
arrow_forward
Step 1
The significance level is 0.01.
Computation of critical value:
α=0.01α2=0.0051-α2=0.995
The critical value of z-distribution can be obtained using the excel formula “=NORM.S.INV (0.995)”. The critical value is 2.576.
Thus, the critical value is ±2.576.
The sample proportion is,
ˆp=xn=424645=0.6574
The sample proportion is 0.6575.
Step by stepSolved in 2 steps

Knowledge Booster
Learn more about
Need a deep-dive on the concept behind this application? Look no further. Learn more about this topic, statistics and related others by exploring similar questions and additional content below.Similar questions
- (5). Calculate SS, variance and standard deviation for the following sample of n=7 scores: 8, 6, 5, 2, 6, 3, 5.arrow_forwardIn a random sample of 925 plain M&M's, 19% were blue. Use a 0.01 significance level to test the claim of Mars, Inc. that 24% of its plain M&M candies are blue. a. Define the parameter A. p = The proportion of all M&M's that are blue B. mu = The proportion of all M&M's that are blue C. mu = The mean number of all M&M's that are blue D. p = The proportion of all M&M's that are not blue b. State the null and alternative hypotheses A. Upper H 0 : p greater than 0.24 Upper H 1 : p equals 0.24 B. Upper H 0 : p equals 0.19 Upper H 1 : p not equals 0.19 C. Upper H 0 : p equals 0.24 Upper H 1 : p not equals 0.24 D. Upper H 0 : mu not equals 0.24 Upper H 1 : mu equals 0.24 c. Calculate the test statistic. Which of these options is closest to the test statistic? A. negative 4.00 B. negative 3.65 C.…arrow_forward1.Determine the test statistic 2. Determine the P-Valuearrow_forward
- Suppose IQ scores were obtained for 20 randomly selected sets of siblings. The 20 pairs of measurements yield x = 99.37, y = 98.55, r=0.859, P-value = 0.000, and y = 10.94 +0.88x, where x represents the IQ score of the older child. Find the best predicted value of y given that the older child has an IQ of 105? Use a significance level of 0.05. 10CritPearson.pdf O A. 98.55 OB. 0.88 O C. 99.37 O D. 103.34arrow_forwardThe coach of a very popular men’s basketball team claims that the average distance the fans travel to the campus to watch a game is 35 miles. The team members feel otherwise. A sample of 16 fans who travel to games was randomly selected and yielded a mean of M= 36 miles and s= 5 miles. Test the coach’s claim at the 5% (.05) level of significance. one-tailed or two-tailed test: State the hypotheses: df= tα or t value for the critical region = sM = t (test statistic)= Decision:arrow_forwardn 4 5 6 7 8 9 10 11 12 13 14 15 16 17 18 19 20 25 30 35 40 45 50 60 70 80 90 100 n x=0.05 0.950 0.878 0.811 0.754 0.707 0.666 0.632 0.602 0.576 0.553 0.532 0.514 0.497 0.482 0.468 0.456 0.444 0.396 0.361 0.335 0.312 0.294 0.279 0.254 0.236 0.220 0.207 0.196 α = 0.05 α = 0.01 0.990 0.959 0.917 0.875 0.834 0.798 0.765 0.735 0.708 0.684 0.661 0.641 0.623 0.606 0.590 0.575 0.561 0.505 0.463 0.430 0.402 0.378 0.361 0.330 0.305 0.286 0.269 0.256 α = 0.01 NOTE: To test Ho: p=0 against H₁: p0, reject Ho if the absolute value of ris greater than the critical value in the table.arrow_forward
- 4. For the following information, determine whether a normal sampling distribution can be used, where p is the population proportion, α is the level of significance, p is the sample proportion, and n is the sample size. If it can be used, test the claim. Claim: p>0.44; α=0.08. Sample statistics: p=0.52, n=350 Question content area bottom Part 1 Let q=1−p and let q=1−p. A normal sampling distribution ▼ can cannot be used here, since ▼ n ModifyingAbove p with caretnp npnp ▼ less than< greater than or equals≥ 5 and ▼ nqnq n ModifyingAbove q with caretnq ▼ less than< greater than or equals≥ 5.arrow_forwardSuppose IQ scores were obtained for 20 randomly selected sets of couples. The 20 pairs of measurements yield x = 101.02, y = 100.75, r = 0.852, P-value = 0.000, and y = 5.93 + 0.94x, where x represents the IQ score of the husband. Find the best predicted value of y given that the husband has an lQ of 100? Use a significance level of 0.05. %3D Click the icon to view the critical values of the Pearson correlation coefficient r. The best predicted value of y is Critical values of the pearson correlation coefficient r (Round to two decimal places as needed.) Critical Values of the Pearson Correlation Coefficient r X = 0.05 a = 0.01 INOTE: To test Ho: p=0 n Jagainst H,: p+0, reject Ho if the absolute value of r is greater than the critical value in the table. 4 0.950 0.990 0.878 0.959 0.811 0.917 7 0.754 0.875 0.707 0.834 0.666 0.798 10 0.632 0.765 11 0.602 0.735 12 0.576 0.708 13 0.553 0.684 14 0.532 0.661 15 0.514 0.641 16 0.497 0.623 17 0.482 0.606 18 0.468 0.590 19 0.456 0.575 20 0.444…arrow_forwardA safety administration conducted crash tests of child booster seats for cars. Listed below are results from those tests, with the measurements given in hic (standard head injury condition units). The safety requirement is that the hic measurement should be less than 1000 hic. Use a 0.01 significance level to test the claim that the sample is from a population with a mean less than 1000 hic. Do the results suggest that all of the child booster seats meet the specified requirement? 600 662 1092 545 496 541 what are the hypothesis? identify the test statistics identify the P-value state the final conclusion that addresses the original claims what do the results suggest about the child booster seats meeting the specified requirement?arrow_forward
arrow_back_ios
arrow_forward_ios
Recommended textbooks for you
 MATLAB: An Introduction with ApplicationsStatisticsISBN:9781119256830Author:Amos GilatPublisher:John Wiley & Sons Inc
 Probability and Statistics for Engineering and th...StatisticsISBN:9781305251809Author:Jay L. DevorePublisher:Cengage Learning
 Statistics for The Behavioral Sciences (MindTap C...StatisticsISBN:9781305504912Author:Frederick J Gravetter, Larry B. WallnauPublisher:Cengage Learning
 Elementary Statistics: Picturing the World (7th E...StatisticsISBN:9780134683416Author:Ron Larson, Betsy FarberPublisher:PEARSON
 The Basic Practice of StatisticsStatisticsISBN:9781319042578Author:David S. Moore, William I. Notz, Michael A. FlignerPublisher:W. H. Freeman
 Introduction to the Practice of StatisticsStatisticsISBN:9781319013387Author:David S. Moore, George P. McCabe, Bruce A. CraigPublisher:W. H. Freeman

MATLAB: An Introduction with Applications
Statistics
ISBN:9781119256830
Author:Amos Gilat
Publisher:John Wiley & Sons Inc

Probability and Statistics for Engineering and th...
Statistics
ISBN:9781305251809
Author:Jay L. Devore
Publisher:Cengage Learning

Statistics for The Behavioral Sciences (MindTap C...
Statistics
ISBN:9781305504912
Author:Frederick J Gravetter, Larry B. Wallnau
Publisher:Cengage Learning

Elementary Statistics: Picturing the World (7th E...
Statistics
ISBN:9780134683416
Author:Ron Larson, Betsy Farber
Publisher:PEARSON

The Basic Practice of Statistics
Statistics
ISBN:9781319042578
Author:David S. Moore, William I. Notz, Michael A. Fligner
Publisher:W. H. Freeman

Introduction to the Practice of Statistics
Statistics
ISBN:9781319013387
Author:David S. Moore, George P. McCabe, Bruce A. Craig
Publisher:W. H. Freeman