
MATLAB: An Introduction with Applications
6th Edition
ISBN: 9781119256830
Author: Amos Gilat
Publisher: John Wiley & Sons Inc
expand_more
expand_more
format_list_bulleted
Related questions
Question
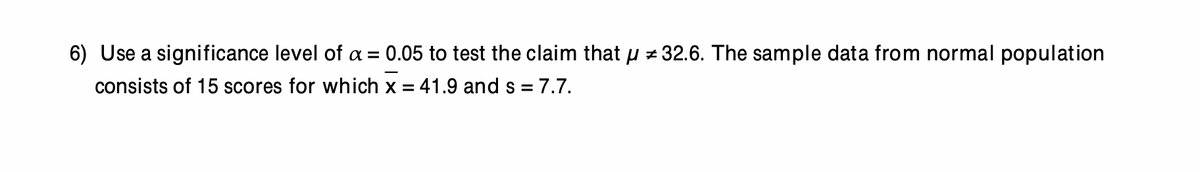

Transcribed Image Text:6) Use a significance level of a = 0.05 to test the claim that µ # 32.6. The sample data from normal population
consists of 15 scores for which x = 41.9 and s = 7.7.
Expert Solution
This question has been solved!
Explore an expertly crafted, step-by-step solution for a thorough understanding of key concepts.

Step by stepSolved in 3 steps with 1 images

Knowledge Booster

Similar questions
- Suppose IQ scores were obtained for 20 randomly selected sets of siblings. The 20 pairs of measurements yield x = 99.37, y=98.55, r=0.859, P-value = 0.000, and y = 10.94 +0.88x, where x represents the IQ score of the older child. Find the best predicted value of y given that the older child has an IQ of 105? Use a significance level of 0.05. 10CritPearson.pdf O A. 98.55 OB. 99.37 O C. 103.34 O D. 0.88arrow_forwardA nutrition expert claims that the average American is overweight: To test his claim, a random sample of 25 Americans was selected, and the difference between each person's actual weight and idea weight was calculated. For this data, we have = 16 and 8 = 28.4. Is there sufficient evidence to conclude that the expert's claim is true? Carry out a hypothesis test at a 8% significance level. Hint: Pay attention to the variable being measured: the difference between actual weight and ideal. A positive value indicates that the person is overweight. A. The value of the standardized test statistic (give to 3 decimal places): B. The p-value is (give to 4 decimal places): C. Your decision for the hypothesis test: O A. Reject Ho- OB. Reject Ha C. Do Not Reject Ha- O D. Do Not Reject Ho- Earrow_forwardSuppose IQ scores were obtained for 20 randomly selected sets of couples. The 20 pairs of measurements yield x97.97, y 98.85, r=0.865, P.value =0.000, and y= 10.04 +0.91x, where x represents the IQ score of the husband. Find the best predicted value of y given that the husband has an IQ of 1087 Use a significance level of 0.05. Click the icon to view the critical values of the Pearson correlation coetficientr. The best predicted value of y is (Round to two decimal places as needed.)arrow_forward
- Suppose IQ scores were obtained for 20 randomly selected sets of twins. The 20 pairs of measurements yield x=97.85, y=98.95, r=0.871, P-value=0.000, and y=17.2+0.84x, where x represents the IQ score of the twin born second. Find the best predicted value of y given that the twin born second has an IQ of 104? Use a significance level of 0.05. The best predicted value of y is ?arrow_forwardIn a study of store checkout scanners, 1234 items were checked and 21 checked items were overcharges. Use a 0.05 significance level to test the claim that with scanners, 1% of sales are overchanrges. (Before scanners were used, the overcharge rate was estimated to be about 1%). a. Define the parameter A. p = The proportion of all sales that are incorrect B. p = The proportion of all sales that are overcharges C. mu = The mean number of sales that are overcharges D. mu = The proportion of all sales that are undercharges b. State the null and alternative hypotheses A. Upper H 0 : p equals 0.01 Upper H 1 : p not equals 0.01 B. Upper H 0 : p equals 21 Upper H 1 : p less than 21 C. Upper H 0 : p greater than 0.01 Upper H 1 : p equals 0.01 D. Upper H 0 : mu not equals 0.01 Upper H 1 : mu equals 0.01 c. Calculate the sample proportion ModifyingAbove p…arrow_forwardSuppose IQ scores were obtained for 20 randomly selected sets of siblings. The 20 pairs of measurements yield x=103.36, y=103.45, r=0.928, P-value= 0.000, and y=−7.2+1.07x,where x represents the IQ score of the older child.Find the best predicted value of y given that the older child has an IQ of 106? Use a significance level of 0.05arrow_forward
- Suppose IQ scores were obtained for 20 randomly selected sets of couples. The 20 pairs of measurements yield x=102.2, y=100.8, r=0.854, P-value=0.000, and y=24.13+0.75x, where x represents the IQ score of the wife. Find the best predicted value of y given that the wife has an IQ of 95? Use a significance level of 0.05. LOADING... Click the icon to view the critical values of the Pearson correlation coefficient r. The best predicted value of y is nothing.arrow_forwardSuppose IQ scores were obtained for 20 randomly selected sets of siblings. The 20 pairs of measurements yield x=100.3, y=101.75, r=0.901, P-value=0.0001, and y=−7.33+1.09x, where x represents the IQ score of the older child. Find the best predicted value of y given that the older child has an IQ of 90. Use a significance level of 0.05.arrow_forwardReports show that 92% of online searches in March 2021 use Google as the search engine. A network administrator wants to determine whether the percentage of searches that use Google is different in their company. They sample 800 searches and find that 758 of them use Google. Can they conclude that the percentage of searches that use Google in this company differs from 92%? Use the a = 0.05 level of significance.arrow_forward
- M&M Candy Colors. Mars, Inc. manufactures M&M’s, one of the most popular candy treats in the world. The milk chocolate candies come in a variety of colors including blue, brown, green, orange, red, and yellow. The overall proportions for the colors are .24 blue, .13 brown, .20 green, .16 orange, .13 red, and .14 yellow. In a sampling study, several bags of M&M milk chocolates were opened and the following color counts were obtained. Use a .05 level of significance and the sample data to test the hypothesis that the overall proportions for the colors are as stated above. What is your conclusion?arrow_forwardSuppose IQ scores were obtained for 20 randomly selected sets of siblings. The 20 pairs of measurements yield x = 98.67, y = 99, r= 0.930, P-value = 0.000, and %3D y = - 12.38 +1.13x, where x represents the IQ score of the younger child. Find the best predicted value of y given that the younger child has an IQ of 97? Use a significance level of 0.05. Click the icon to view the critical values of the Pearson correlation coefficient r. The best predicted value of y is (Round to two decimal places as needed.)arrow_forwardSuppose IQ scores were obtained for 20 randomly selected sets of couples. The 20 pairs of measurements yield x=100.74, y=103.1, r=0.906, P-value=0.000, and y=12.63+0.9x, where x represents the IQ score of the husband. Find the best predicted value of y given that the husband has an IQ of 105? Use a significance level of 0.05.arrow_forward
arrow_back_ios
SEE MORE QUESTIONS
arrow_forward_ios
Recommended textbooks for you
- MATLAB: An Introduction with ApplicationsStatisticsISBN:9781119256830Author:Amos GilatPublisher:John Wiley & Sons Inc
 Probability and Statistics for Engineering and th...StatisticsISBN:9781305251809Author:Jay L. DevorePublisher:Cengage Learning
 Statistics for The Behavioral Sciences (MindTap C...StatisticsISBN:9781305504912Author:Frederick J Gravetter, Larry B. WallnauPublisher:Cengage Learning
  Elementary Statistics: Picturing the World (7th E...StatisticsISBN:9780134683416Author:Ron Larson, Betsy FarberPublisher:PEARSON
 The Basic Practice of StatisticsStatisticsISBN:9781319042578Author:David S. Moore, William I. Notz, Michael A. FlignerPublisher:W. H. Freeman
 Introduction to the Practice of StatisticsStatisticsISBN:9781319013387Author:David S. Moore, George P. McCabe, Bruce A. CraigPublisher:W. H. Freeman
MATLAB: An Introduction with Applications
Statistics
ISBN:9781119256830
Author:Amos Gilat
Publisher:John Wiley & Sons Inc
Probability and Statistics for Engineering and th...
Statistics
ISBN:9781305251809
Author:Jay L. Devore
Publisher:Cengage Learning
Statistics for The Behavioral Sciences (MindTap C...
Statistics
ISBN:9781305504912
Author:Frederick J Gravetter, Larry B. Wallnau
Publisher:Cengage Learning
Elementary Statistics: Picturing the World (7th E...
Statistics
ISBN:9780134683416
Author:Ron Larson, Betsy Farber
Publisher:PEARSON
The Basic Practice of Statistics
Statistics
ISBN:9781319042578
Author:David S. Moore, William I. Notz, Michael A. Fligner
Publisher:W. H. Freeman
Introduction to the Practice of Statistics
Statistics
ISBN:9781319013387
Author:David S. Moore, George P. McCabe, Bruce A. Craig
Publisher:W. H. Freeman