
MATLAB: An Introduction with Applications
6th Edition
ISBN: 9781119256830
Author: Amos Gilat
Publisher: John Wiley & Sons Inc
expand_more
expand_more
format_list_bulleted
Related questions
Question
thumb_up100%
A. Find the FSTAT
B. Find the P-value
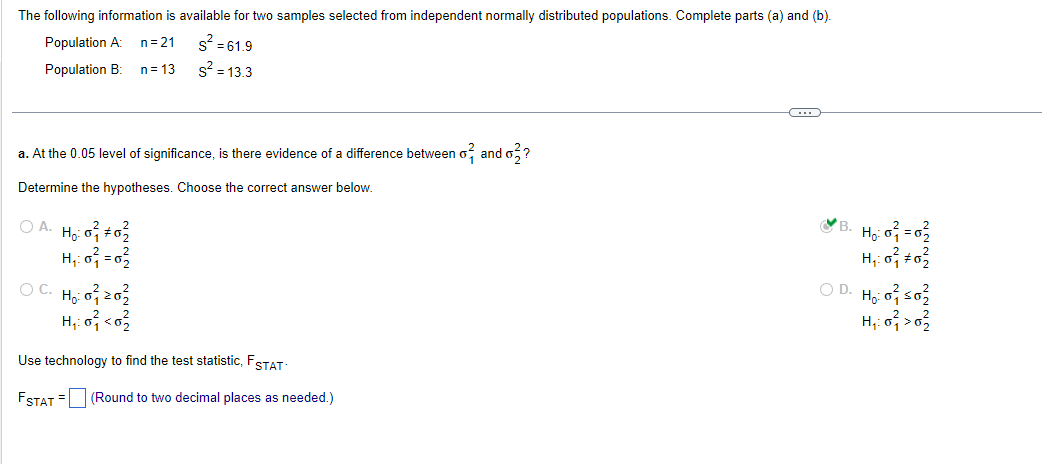

Transcribed Image Text:The following information is available for two samples selected from independent normally distributed populations. Complete parts (a) and (b).
Population A: n = 21
Population B: n = 13
S² = 61.9
s² = 13.3
a. At the 0.05 level of significance, is there evidence of a difference between of and o²?
Determine the hypotheses. Choose the correct answer below.
O A. H₁: 0²1 0²2
H₁:0=03
OC. Ho: 07202
H₁:0² < 0²/
Use technology to find the test statistic, FSTAT
FSTAT = (Round to two decimal places as needed.)
C
B. H₂:0² = 0₂
H₁: 0²1 0²2
OD. Ho: 050₂
H₁:0² > 0²/
Expert Solution
arrow_forward
Step 1: We have given
For sample 1
For sample 2

Step by stepSolved in 3 steps with 1 images

Knowledge Booster

Similar questions
- Carl Catcher has a batting average of .370, meaning that he makes a hit 37% of the times he is up at bat. Pete Pitcher has a batting averager of only .110. Let x be the number of times Carol comes up to bat and let y be the number of times Pete comes to bat. a. If Carl bats 7 times and Pete bats 3 times, what should ther overall batting average be? b. If a total of 50 times at bat, how many times may Pete bat in order for their combined average to be as close as possible to .300? (define 3 variables, write system and solve)arrow_forwardFind the z-score corresponding to a score of X=50. u=60 and o=5 u=45 and o=5 u=40 and o=5 u=37 and o=5 u=59 and o=5arrow_forwardAn agricultural experimenter divided a tract of land into seven plots of equal size. Each plot was treated with different levels of fertilizer to determine whether the level of fertilizer application affects yield. The results are shown below: Plot F 5.5 Level of Fertilizer, X Yleld (in Ibs), Y 3.0 3.5 4.0 4.5 5.0 6.0 53 57 56 58 62 59 63 What is the simple power equation for the given pairs of data? OY = 1.6266X^0.0216 OY = 0.2109X^0.0216 OY = 1.6266X^0.2155 %3D OY- 0.2109X^0.2155 O none of the abovearrow_forward
arrow_back_ios
arrow_forward_ios
Recommended textbooks for you
- MATLAB: An Introduction with ApplicationsStatisticsISBN:9781119256830Author:Amos GilatPublisher:John Wiley & Sons Inc
 Probability and Statistics for Engineering and th...StatisticsISBN:9781305251809Author:Jay L. DevorePublisher:Cengage Learning
 Statistics for The Behavioral Sciences (MindTap C...StatisticsISBN:9781305504912Author:Frederick J Gravetter, Larry B. WallnauPublisher:Cengage Learning
  Elementary Statistics: Picturing the World (7th E...StatisticsISBN:9780134683416Author:Ron Larson, Betsy FarberPublisher:PEARSON
 The Basic Practice of StatisticsStatisticsISBN:9781319042578Author:David S. Moore, William I. Notz, Michael A. FlignerPublisher:W. H. Freeman
 Introduction to the Practice of StatisticsStatisticsISBN:9781319013387Author:David S. Moore, George P. McCabe, Bruce A. CraigPublisher:W. H. Freeman
MATLAB: An Introduction with Applications
Statistics
ISBN:9781119256830
Author:Amos Gilat
Publisher:John Wiley & Sons Inc
Probability and Statistics for Engineering and th...
Statistics
ISBN:9781305251809
Author:Jay L. Devore
Publisher:Cengage Learning
Statistics for The Behavioral Sciences (MindTap C...
Statistics
ISBN:9781305504912
Author:Frederick J Gravetter, Larry B. Wallnau
Publisher:Cengage Learning
Elementary Statistics: Picturing the World (7th E...
Statistics
ISBN:9780134683416
Author:Ron Larson, Betsy Farber
Publisher:PEARSON
The Basic Practice of Statistics
Statistics
ISBN:9781319042578
Author:David S. Moore, William I. Notz, Michael A. Fligner
Publisher:W. H. Freeman
Introduction to the Practice of Statistics
Statistics
ISBN:9781319013387
Author:David S. Moore, George P. McCabe, Bruce A. Craig
Publisher:W. H. Freeman