
A First Course in Probability (10th Edition)
10th Edition
ISBN: 9780134753119
Author: Sheldon Ross
Publisher: PEARSON
expand_more
expand_more
format_list_bulleted
Related questions
Question
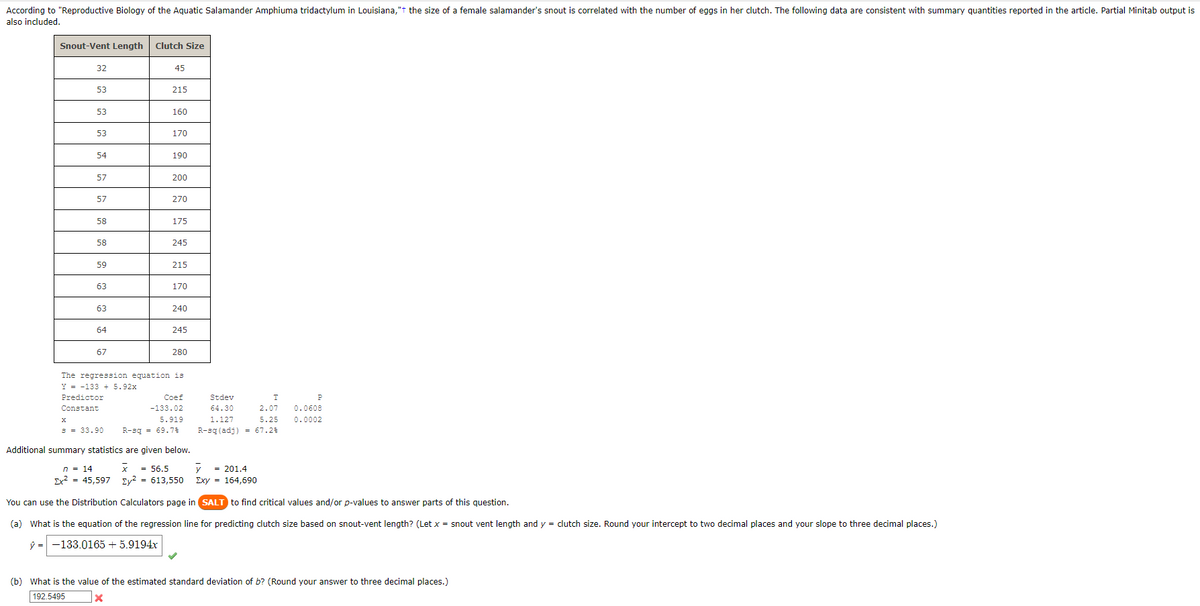

Transcribed Image Text:According to "Reproductive Biology of the Aquatic Salamander Amphiuma tridactylum in Louisiana,"t the size of a female salamander's snout is correlated with the number of eggs in her clutch. The following data are consistent with summary quantities reported in the article. Partial Minitab output is
also included.
Snout-Vent Length
Clutch Size
32
45
53
215
53
160
53
170
54
190
57
200
57
270
58
175
58
245
59
215
63
170
63
240
64
245
67
280
The regression equation is
Y = -133 + 5.92x
Predictor
Coef
Stdev
T
P
Constant
-133.02
64.30
2.07
0.0608
5.919
1.127
5.25
0.0002
3 = 33.90
R-sq = 69.7
R-sq (adj) = 67.2%
Additional summary statistics are given below.
n - 14
= 56.5
= 201.4
Ex? = 45,597 Ey? = 613,550 Exy = 164,690
You can use the Distribution Calculators page in SALT to find critical values and/or p-values to answer parts of this question.
(a) What is the equation of the regression line for predicting clutch size based on snout-vent length? (Let x = snout vent length and y = clutch size. Round your intercept to two decimal places and your slope to three decimal places.)
ý = -133.0165 + 5.9194x
(b) What is the value of the estimated standard deviation of b? (Round your answer to three decimal places.)
192.5495
Expert Solution
This question has been solved!
Explore an expertly crafted, step-by-step solution for a thorough understanding of key concepts.

Step by stepSolved in 2 steps with 1 images

Knowledge Booster

Similar questions
- Why the regression line is a straight line rather than a curved line?arrow_forwardI’m taking a statistics and probability class. Please get this correct because I want to learn. I have gotten wrong answers on here beforearrow_forwardI was wondering specifically about part D and how to interpret my findings.arrow_forward
- There are 6 parts for this Question. Please helparrow_forwardThe data show the bug chirps per minute at different temperatures. Find the regression equation, letting the first variable be the independent (x) variable. Find the best-predicted temperature for a time when a bug is chirping at the rate of 3000chirps per minute. Use a significance level of 0.05. What is wrong with this predicted value? Chirps in 1 min 1004 952 1237 1116 1177 1249 Temperature (°F) 83.1 76 95.1 87.5 92.1 88.4 What is the regression equation? (^ over y)=_____+_____x (Round the x-coefficient to four decimal places as needed. Round the constant to two decimal places as needed.) What is the best-predicted temperature for a time when a bug is chirping at the rate of 3000chirps per minute? The best-predicted temperature when a bug is chirping at 3000 chirps per minute is ____°F. (Round to one decimal place as needed.) What is wrong with this predicted value? Choose the correct answer below. A. It is…arrow_forwardYou believe that the price of Zoom Videoconferencing stock and the price of American Airlines stock will move in opposite directions. In order to test this relationship, we do a simple regression with the following variables:A - dependent variable : month end price of American Airlines stockZ - independent variable: month end price of Zoom Videoconferencing stock Data from April 2019 through December 2020 (21 observations) is availableBased on the data, we compute the following:Var (Z) = 20927.702Cov (A,Z) = -899.153E(A) = 20.790E(Z) = 187.530Std Error of Estimate = 6.088TSS = 1476.830 Consider the equation At = b0 + b1 Zt + εtBased on the numbers given above, complete the following table Variable Estimate Std error t-statistic Slope b1 .00941 Constant b0 2.2088 R-square N/A N/A F statistic N/A N/A Are the coefficients (slope and/or constant) significant at the .05 level?arrow_forward
- The data show the chest size and weight of several bears. Find the regression equation, letting chest size be the independent (x) variable. Then find the best predicted weight of a bear with a chest size of 63 inches. Is the result close to the actual weight of 562 pounds? Use a significance level of 0.05. Chest_size_(inches) Weight_ (pounds)58 41450 31265 49959 45059 45648 260 What is the regression equation?^y = ____ + _____ x (round to one decimal place as needed.)What Is the best predicted weight of a bear with a chest size of 63 inches? ^y =____ pounds (round one decimal as needed)Is the result close to the actual weight of 452 pounds?(a) This result is very close to the actual weight of the bear.(b) This result is close to the actual weight of the bear.(c) This result is exactly…arrow_forwardExplain the process of Computing the Regression Line?arrow_forwardIs it reasonable to interpret the y-intercept of the regression line? Why or why not? One home that is 1,750 square feet is listed at $590,000. Is this home's price above or below average for a home of this size? Use residuals and show your work to answer. footaget) ## (Intercept) 21.14411 136.31449 0.155 0.87954 ## footage 0.28388 0.08516 3.333 0.00667 ** ## Residual standard error: 71.64 on 11 degrees of freedom ## Multiple R-squared: 0.5025, Adjusted R-squared: 0.4573 ## F-statistic: 11.11 on 1 and 11 DF, p-value: 0.006671arrow_forward
- Describe regression variation in terms of variation in Y.arrow_forwardUsing the data in the Excel spreadsheet "auto.xlsx", estimate a regression to answer the following question. How much does a 1 inch increase in LENGTH corresponds to a _________________ dollars increase in PRICE. Use negative values if it results in a decreased price. Round your answers to two decimals.arrow_forwardUsing the data in the Excel spreadsheet "auto.xlsx", estimate a regression to answer the following question. A 1 inch increase in LENGTH corresponds to a _________________ increase in MPG (miles per gallon). Use negative values if it results in a decreased price. Round your answers to two decimals. make price mpg rep78 headroom trunk weight length turn displacement gear_ratio foreign AMC Concord 4,099 22 3 3 11 2,930 186 40 121 3.58 Domestic AMC Pacer 4,749 17 3 3 11 3,350 173 40 258 2.53 Domestic AMC Spirit 3,799 22 3 12 2,640 168 35 121 3.08 Domestic Buick Century 4,816 20 3 5 16 3,250 196 40 196 2.93 Domestic Buick Electra 7,827 15 4 4 20 4,080 222 43 350 2.41 Domestic Buick LeSabre 5,788 18 3 4 21 3,670 218 43 231 2.73 Domestic Buick Opel 4,453 26 3 10 2,230 170 34 304 2.87 Domestic Buick Regal 5,189 20 3 2 16 3,280 200 42 196 2.93 Domestic Buick Riviera 10,372 16 3 4 17 3,880 207 43 231 2.93 Domestic Buick Skylark 4,082 19 3 4 13 3,400 200 42 231…arrow_forward
arrow_back_ios
arrow_forward_ios
Recommended textbooks for you
- A First Course in Probability (10th Edition)ProbabilityISBN:9780134753119Author:Sheldon RossPublisher:PEARSON

A First Course in Probability (10th Edition)
Probability
ISBN:9780134753119
Author:Sheldon Ross
Publisher:PEARSON