MATLAB: An Introduction with Applications
6th Edition
ISBN: 9781119256830
Author: Amos Gilat
Publisher: John Wiley & Sons Inc
expand_more
expand_more
format_list_bulleted
Concept explainers
Topic Video
Question

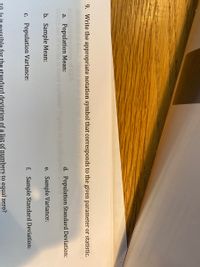
Transcribed Image Text:9. Write the appropriate notation symbol that corresponds to the given parameter or statistic.
a. Population Mean:
tof births
d. Population Standard Deviation:
variable? Triplets
b. Sample Mean:
e. Sample Variance:
c. Population Variance:
f. Sample Standard Deviation:
sihle for the standard deviation of a list of numbers to equal zero?
Expert Solution
This question has been solved!
Explore an expertly crafted, step-by-step solution for a thorough understanding of key concepts.
Step by stepSolved in 2 steps

Knowledge Booster
Learn more about
Need a deep-dive on the concept behind this application? Look no further. Learn more about this topic, statistics and related others by exploring similar questions and additional content below.Similar questions
- Use the data in the following table, which lists carbon dioxide concentrations (in parts per million) for each year from 1960 to 2009, with projected values used for the last four years. After finding the values of the mean and range for each decade, find the values of x,and R. Also find the values of LCL and UCL for an R chart, and find the values of LCL and UCL for an x chart. Atmospheric Carbon Dioxide Concentrations (in parts per million) 1960s 313.3 315.1 315.8 317.2 319.4 320.4 321.9 323.2 324.8 326.4 1970s 327.9 329.7 331.5 333.1 334.8 335.3 337.1 337.9 340.5 341.6 1980s 342.8 344.8 345.8 347.1 349.1 350.6 352.1 352.8 355.4 355.8 1990s 357.5 358.9 360.7 361.9 363.9 365.3 366.4 367.8 369.6 370.5 2000s 372.2 374.7 376.2 376.6 377.8 379.5 381.1 382.7 384.6 385.8 x=enter your response here (Round to three decimal places as needed.)…arrow_forwardA data set has five values. The largest value is 26. The median is 19. The mode is 15. The mean is 19.2. The data, in order from least to greatest is: , , , ,arrow_forwardhe following refer to the following data set: 93 32 100 28 82 93 30 72 84 63 What is the mean (¯xx¯) of this data set?mean = (Please show your answer to one decimal place.)What is the median of this data set?median = What is the mode of this data set?mode =arrow_forward
- The population mean, u, is a measure ofarrow_forwarda) Is this histogram symmetric, left-skewed, or right skewed? b) Moving left to right, in what order would you see the mean, median, and mode?arrow_forwardHow do the sample mean and the population mean differ? What is the symbol for each type of mean?arrow_forward
- Consider the data set 9 6 2 6 7 2 7 1 4 8 9 Find the average (mean): Find the median:arrow_forwardFind the mean and median (in that order) for the data set: 2,5,2,8,3, a. 2,4 b. 4,2 c 3,4 d 4,3arrow_forwardThe mean scores for students in a statistics course (by major) are shown below. What is the mean score for the class? 9 engineering majors: 90 5 math majors: 94 13 business majors: 76 The class's mean score is________ (Type an integer or a decimal rounded to two decimal places as needed.)arrow_forward
- A population of grades for a statistics class of six students is given below: 71,63,68,80,85,82 Find the variance for this population. Population Variance =arrow_forwardSymbols for the following: sample size sample mean population proportionarrow_forwardConsider the data set: 7 8 4 2 1 3 9 3 Find the mean: (Round your answer to 3 decimal places if necessary) Find the median: (Round your answer to 3 decimal places if necessary)arrow_forward
arrow_back_ios
SEE MORE QUESTIONS
arrow_forward_ios
Recommended textbooks for you
 MATLAB: An Introduction with ApplicationsStatisticsISBN:9781119256830Author:Amos GilatPublisher:John Wiley & Sons Inc
 Probability and Statistics for Engineering and th...StatisticsISBN:9781305251809Author:Jay L. DevorePublisher:Cengage Learning
 Statistics for The Behavioral Sciences (MindTap C...StatisticsISBN:9781305504912Author:Frederick J Gravetter, Larry B. WallnauPublisher:Cengage Learning
 Elementary Statistics: Picturing the World (7th E...StatisticsISBN:9780134683416Author:Ron Larson, Betsy FarberPublisher:PEARSON
 The Basic Practice of StatisticsStatisticsISBN:9781319042578Author:David S. Moore, William I. Notz, Michael A. FlignerPublisher:W. H. Freeman
 Introduction to the Practice of StatisticsStatisticsISBN:9781319013387Author:David S. Moore, George P. McCabe, Bruce A. CraigPublisher:W. H. Freeman

MATLAB: An Introduction with Applications
Statistics
ISBN:9781119256830
Author:Amos Gilat
Publisher:John Wiley & Sons Inc

Probability and Statistics for Engineering and th...
Statistics
ISBN:9781305251809
Author:Jay L. Devore
Publisher:Cengage Learning

Statistics for The Behavioral Sciences (MindTap C...
Statistics
ISBN:9781305504912
Author:Frederick J Gravetter, Larry B. Wallnau
Publisher:Cengage Learning

Elementary Statistics: Picturing the World (7th E...
Statistics
ISBN:9780134683416
Author:Ron Larson, Betsy Farber
Publisher:PEARSON

The Basic Practice of Statistics
Statistics
ISBN:9781319042578
Author:David S. Moore, William I. Notz, Michael A. Fligner
Publisher:W. H. Freeman

Introduction to the Practice of Statistics
Statistics
ISBN:9781319013387
Author:David S. Moore, George P. McCabe, Bruce A. Craig
Publisher:W. H. Freeman