A First Course in Probability (10th Edition)
10th Edition
ISBN: 9780134753119
Author: Sheldon Ross
Publisher: PEARSON
expand_more
expand_more
format_list_bulleted
Concept explainers
Topic Video
Question

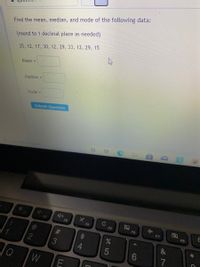
Transcribed Image Text:Find the mean, median, and mode of the following data:
(round to 1 decimal place as needed)
35, 12, 17, 30, 12, 29, 33, 12, 29, 15
Mean =
Median =
Mode =
Submit Question
F1
F2
Cc
F3
F4
F5
F6
F7
F8
%23
24
&
3
7
W
CO
5
LLF
Expert Solution
arrow_forward
Step 1 Introduction:
Mean: Mean is defined as the ratio of sum of all observations to the total number of all observations and it is given by
where = sum of all observations
and n = total number of all observations.
- Mean is most affected by the extreme outliers.
Median: Median is exactly middle value of the data.
Before going to find the Median arrange the in the Ascending Order.
Case (i) : If the data set is odd numbered, then Median is exactly the middle value.
Case (ii) : If the data set is even numbered, then Median is the average of the two middle values.
- Median is least affected by the extreme values.
Mode: Mode is the most frequently repeated value in the data set.
- Mode is least affected by the extreme values.
Trending nowThis is a popular solution!
Step by stepSolved in 2 steps

Knowledge Booster
Learn more about
Need a deep-dive on the concept behind this application? Look no further. Learn more about this topic, probability and related others by exploring similar questions and additional content below.Similar questions
- Use the dotplot to find the mean, median, and IQR. Round to 1 decimal place, if needed. Caution: This could be a different data set than the one in the previous question. 74 76 78 80 82 84 86 Heights of Basketball Players mean median IQR (in inches) (in inches) (in inches)arrow_forwardUse the following data set: 8, 3, 5, 2, 8, 4, 2, 6, 7, 5, 8 to answer questions The range of the data is……..arrow_forwardConsider a data set: 1, 2, 5, 6, 7, 6. Find the range, variance, and standard deviation for this data set Please answer quicklyarrow_forward
- A local store owner is interested in finding the mean age of her customers. She randomly surveys 82 customers and records their age. Identify the population, sample, variable, type of variable, parameter, and statistic.arrow_forwardFind the mean, median and modearrow_forwardUse the magnitudes (Richter scale) of the earthquakes listed in the data set below. Find the mean and median of this data set. Is the magnitude of an earthquake measuring 7.0 on the Richter scale an outlier (data value that is very far away from the others) when considered in the context of the sample data given in this data set? Explain. a. Find the mean and median of the data set using a calculator or similar data analysis technology. The mean of the data set is (Round to three decimal places as needed.) b. The median of the data set is (Round to three decimal places as needed.)arrow_forward
- Find the midrange for the following group of data items. 112, 52, 82, 52, 72 (Round to the nearest tenth as needed.)arrow_forwardToday, all boats in the Harbor Tour Fishing Company caught a total of six salmon with weights as follows in pounds: 16, 23, 18, 31, 14, and 19. Calculate the mean (show the appropriate formula) the median (use the median location formula; interpret the medial weight) and the mode. Is the mean here a statistic or parameter? Explainarrow_forwardFind the mean, median, and mode of the data, if possible. If any of these measures cannot be found or a measure does not represent the center of the data, explain why. A sample of seven admission test scores for a professional school are listed below. 11.1 , 10.7 , 10.4 , 9.5 , 11 , 9.5 , 11.4 What is the mean score? Select the correct choice below and fill in any answer box to complete your choice. A. The mean score is= (Round to one decimal place as needed.) B. There is no mean score. What is the median score? Select the correct choice below and fill in any answer box to complete your choice. A. The median score is= (Round to one decimal place as needed.) B. There is no median score. What is the mode of the scores? Select the correct choice below and fill in any answer box to complete your choice. A. The mode(s) of the scores is (are)= (Use a comma to separate answers as needed.) B. There is no mode.arrow_forward
- Find the mean for the following group of data items. 74, 71, 73, 66, 71, 77 The mean is 72. (Type an integer or a decimal.)arrow_forwardPart 2arrow_forwardd) Create a 99% Confidence interval for the mean. Provide a sketch of the critical value and calculate the standard error. Only for this part use o = 23.8arrow_forward
arrow_back_ios
SEE MORE QUESTIONS
arrow_forward_ios
Recommended textbooks for you
 A First Course in Probability (10th Edition)ProbabilityISBN:9780134753119Author:Sheldon RossPublisher:PEARSON

A First Course in Probability (10th Edition)
Probability
ISBN:9780134753119
Author:Sheldon Ross
Publisher:PEARSON
