
MATLAB: An Introduction with Applications
6th Edition
ISBN: 9781119256830
Author: Amos Gilat
Publisher: John Wiley & Sons Inc
expand_more
expand_more
format_list_bulleted
Related questions
Question

Transcribed Image Text:Researchers investigated the propensity of patients in emergency rooms to be prescribed pain medication. The
dataset for this study included the discharge notes of over 4000 patients attending a hospital emergency room
between 2014 and 2019.
Choshen-hillel, S., Sadras, I., Gordon-hecker, T., Genzer, S., Rekhtman, D., & Caruso, E. M. (2022). Physicians
prescribe fewer analgesics during night shifts than day shifts. Proceedings of the National Academy of Sciences,
119(27), e2200047119.
Two of the variables collected are described below:
Shift Type The type of shift the attending physician
was working at the time the patient was
seen.
- Day shift
(8 or 15 hour shift starting at 8am)
- Night shift
(12 or 16 hour shift starting at 8pm)
Prescription
Whether or not pain medication was
prescribed
- Prescribed
- Not prescribed
The data collected on these two variables is displayed in the two-way table of counts below:
Shift type
Not-prescribed Total
1644
2893
831
1264
2475
4157
Table 1: A two-way table of counts of the patient data
Prescription
Day shift
Night shift
Prescribed
1249
433
1682
Let:
Pd be the underlying proportion of patients,
seen by a Day shift physician, who
received a prescription for pain
medication.
and
Pn be the underlying proportion of patients,
seen by a Night shift physician, who
received a prescription for pain medication.
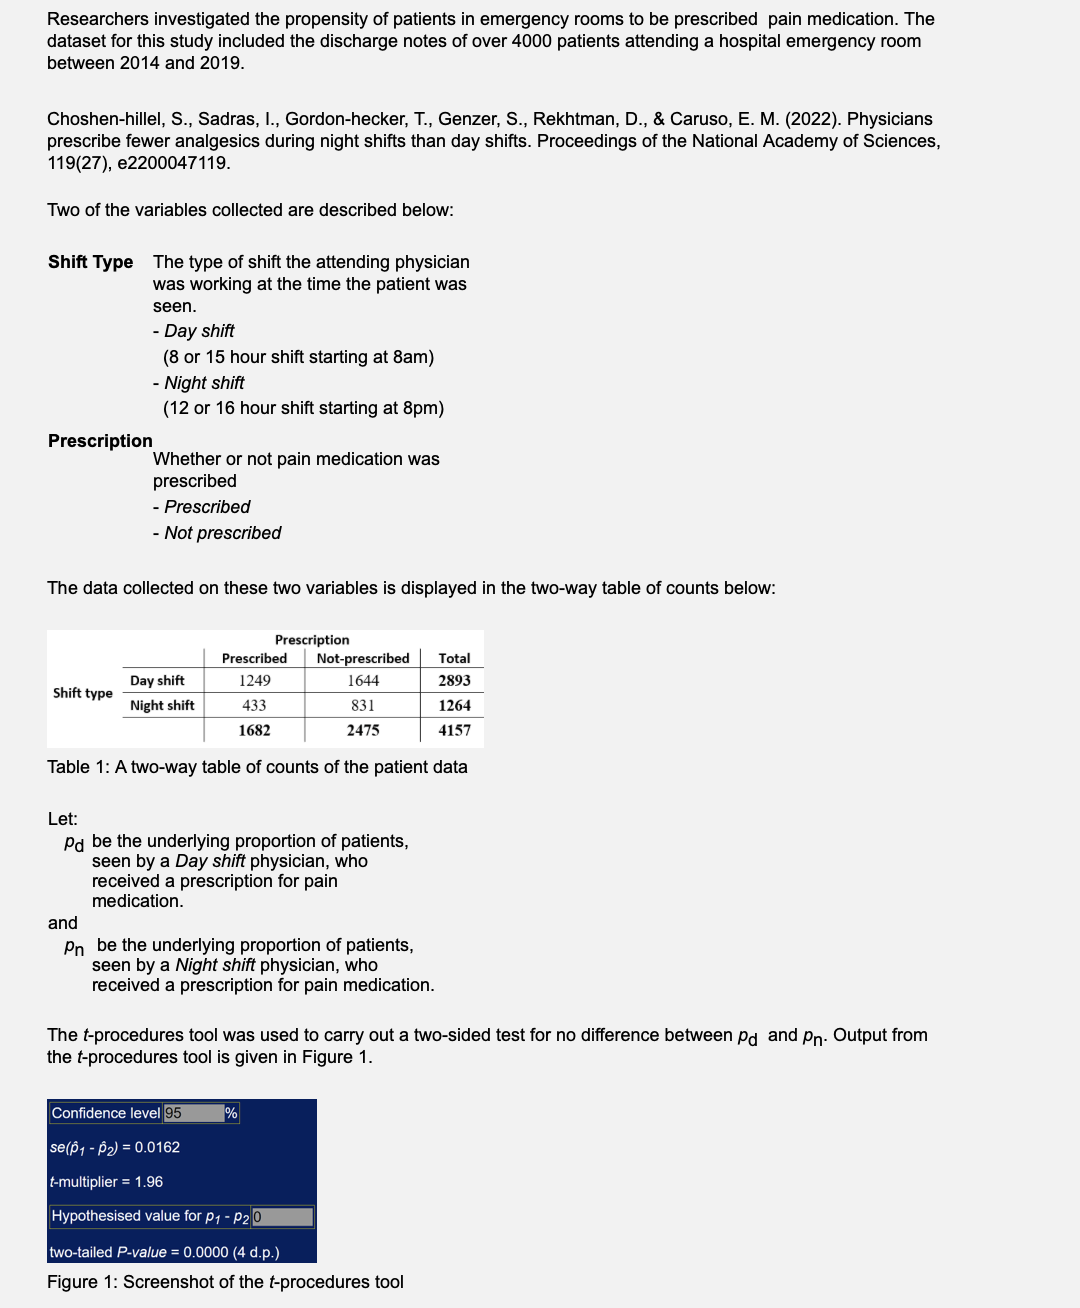
The t-procedures tool was used to carry out a two-sided test for no difference between pd and pn. Output from
the t-procedures tool is given in Figure 1.
Confidence level 95
se(p1 - ₂) = 0.0162
t-multiplier = 1.96
Hypothesised value for P1 - P20
two-tailed P-value = 0.0000 (4 d.p.)
Figure 1: Screenshot of the t-procedures tool

Transcribed Image Text:15. Which one of the following is a correct set of hypotheses for this t-test?
Ho Pd - Pn=0
H₁: pd - Pn>0
O
O
Ho pd pn=0
H1 pd pn 0
Ho Pd - Pn 0
pd - Pn> 0
H1
Ho pd pn 0
H1: pd - În = 0
Ho Pd - Pn = 0
H1: pd - Pn #0
Expert Solution
This question has been solved!
Explore an expertly crafted, step-by-step solution for a thorough understanding of key concepts.

Step by stepSolved in 2 steps

Knowledge Booster

Similar questions
- Previously, 3% of mothers smoked more than 21 cigarettes during their pregnancy. An obstetrician believes that the percentage of mothers who smoke 21 cigarettes or more is less than 3% today. She randomly selects 145 pregnant mothers and finds that 3 of them smoked 21 or more cigarettes during pregnancy. Test the researcher's statement at the a = 0.1 level of significance. What are the null and alternative hypotheses? Ho: versus H,: (Type integers or decimals. Do not round.)arrow_forward14% of all college students volunteer their time. Is the percentage of college students who are volunteers different for students receiving financial aid? Of the 363 randomly selected students who receive financial aid, 40 of them volunteered their time. What can be concluded at the αα = 0.01 level of significance? For this study, we should use The null and alternative hypotheses would be: H0:H0: (please enter a decimal) H1:H1: (Please enter a decimal) The test statistic = (please show your answer to 3 decimal places.) The p-value = (Please show your answer to 4 decimal places.) The p-value is αα Based on this, we should the null hypothesis. Thus, the final conclusion is that ... The data suggest the population proportion is not significantly different from 14% at αα = 0.01, so there is sufficient evidence to conclude that the percentage of financial aid recipients who volunteer is equal to 14%. The data suggest the populaton…arrow_forwardA 95% confidence interval of the mean is (10, 15). The result of testing Ho:H=12 against H:u#12, at 0.05 level of significance, will be Do not reject the null hypothesis because 12 is between 10 and 15 There is insufficient information to make any conclusions about the hypothesis test Reject the null hypothesis because 12 is more than 10 Do not reject the the null hypothesis because 12 is less than 15arrow_forward
- Previously, 5% of mothers smoked more than 21 cigarettes during their pregnancy. An obstetrician believes that the percentage of mothers who smoke 21 cigarettes or more is less than 5% today. She randomly selects 155 pregnant mothers and finds that 6 of them smoked 21 or more cigarettes during pregnancy. Test the researcher's statement at the a = 0.1 level of significance. What are the null and alternative hypotheses? < 0.05 = 0.05 versus H,: p (Type integers or decimals. Do not round.) Но: р Because npo (1- Po) =|| V10, the normal model (Round to one decimal place as needed.) V be used to approximate the P-value.arrow_forwardOnly 17% of registered voters voted in the last election. Will voter participation decline for the upcoming election? Of the 391 randomly selected registered voters surveyed, 47 of them will vote in the upcoming election. What can be concluded at the αα= 0.01 level of significance?For this study, we should use The null and alternative hypotheses would be: H0:H0:(please enter a decimal) H1:H1:(Please enter a decimal)The test statistic = (please show your answer to 3 decimal places.)The p-value = (Please show your answer to 4 decimal places.)The p-value is ααBased on this, we should the null hypothesis.Thus, the final conclusion is that ... The data suggest the populaton proportion is significantly lower than 17% at αα= 0.01, so there is statistically significant evidence to conclude that the the percentage of all registered voters who will vote in the upcoming election will be lower than 17%.The data suggest the population proportion is not significantly lower than 17% at αα= 0.01, so…arrow_forwardLet x1, X2, ..., Xn be a random sample from a normal population with unknown mean u and an unknown variance o?. At a given significance level a, derive the generalized likelihood ratio test for Ho : o 5. versus Completely specify the test when a = population: 0.05 and n = 26. Does the power function of the test depend on the mean of the The following `answers" have been proposed. %3B 26 (a) For a = 0.05 and n = 26 the test rejects Ho when E(X; – X„)² > 941.25. The power function of the test indirectly depends on the population mean u via = 7. (b) For a = 0.05 and n = 26 the test rejects Ho when E(X; – Xn)² > 941.25. The power function of the test does not depend on the population mean µ. (c) For a = 26 ,26 0.05 and n = 26 the test rejects Ho when E(X; – Xn)² > 188.25. The power function of the test does not depend on the population mean µ. (d) For a = 0.05 and n = 26 the test rejects Ho when E(X; – X„)² > 188.25. The power function of the test indirectly depends on the population mean…arrow_forward
- find the p-value for the hypothesis test with the standard test statistic z. decide whether to reject H0 for the level of significanceα 14. Left-tailed test (z=-1.55, α=0.05) 16. Right-tailed test (z=1.23, α=0.10) 18. Two-tailed test (z=1.95, α=0.08)arrow_forward7 FI A random sample of ni = 246 people who live in a city were selected and 70 identified as a "dog person." A random sample of n2 Find the 99% confidence interval for the difference in the proportion of people that live in a city who identify as a "dog person" and the proportion of people that live in a rural area who identify as a "dog person.' %3D 112 people who live in a rural area were selected and 62 identified as a "dog person." %3D Round answers to to 4 decimal places. Question Help: Message instructor Submit Question MacBook Pro %23 % 3. 00 R. S. H. K.arrow_forward14% of all Americans suffer from sleep apnea. A researcher suspects that a different percentage of those who live in the inner city have sleep apnea. Of the 325 people from the inner city surveyed, 62 of them suffered from sleep apnea. What can be concluded at the level of significance of αα = 0.05? Round numerical answers to 3 decimal places For this study, we should use The null and alternative hypotheses would be: Ho: (please enter a decimal) H1: (Please enter a decimal) The test statistic = (please show your answer to 3 decimal places.) The p-value = (Please show your answer to 4 decimal places.) The p-value is αα Based on this, we should the null hypothesis. Thus, the final conclusion is that ... The data suggest the population proportion is not significantly different from 14% at αα = 0.05, so there is not sufficient evidence to conclude that the population proportion of inner city residents who have sleep apnea is different…arrow_forward
- Previously, 5% of mothers smoked more than 21 cigarettes during their pregnancy. An obstetrician believes that the percentage of mothers who smoke 21 cigarettes or more is less than 5% today. She randomly selects 150 pregnant mothers and finds that 5 of them smoked 21 or more cigarettes during pregnancy. Test the researcher's statement at the a = 0.05 level of significance. What are the null and alternative hypotheses? = 0.05 versus H,: p < 0.05 Ho: P (Type integers or decimals. Do not round.) Because npo (1- Po) = [ (Round to one decimal place as needed.) V 10, the normal model V be used to approximate the P-value.arrow_forwardThe study shows that for lung cancer, less than 5% of patients were cured in Denmark and Poland, whereas more than 10% of patients were cured in Spain. To test the claim regarding proportion of cured cancer patients in Spain, a random sample of 500 patients yielded 39 who were cured. Perform the appropriate test of hypothesis to write your conclusion. Hо: р = 0.10 versus Ha:p > 0.10. Reject Ho Но: р 3 = 0.10 versus Ha:p 0.10. Accept Hoarrow_forwardPlease help show me how to get the values of t= and P-valuearrow_forward
arrow_back_ios
SEE MORE QUESTIONS
arrow_forward_ios
Recommended textbooks for you
- MATLAB: An Introduction with ApplicationsStatisticsISBN:9781119256830Author:Amos GilatPublisher:John Wiley & Sons Inc
 Probability and Statistics for Engineering and th...StatisticsISBN:9781305251809Author:Jay L. DevorePublisher:Cengage Learning
 Statistics for The Behavioral Sciences (MindTap C...StatisticsISBN:9781305504912Author:Frederick J Gravetter, Larry B. WallnauPublisher:Cengage Learning
  Elementary Statistics: Picturing the World (7th E...StatisticsISBN:9780134683416Author:Ron Larson, Betsy FarberPublisher:PEARSON
 The Basic Practice of StatisticsStatisticsISBN:9781319042578Author:David S. Moore, William I. Notz, Michael A. FlignerPublisher:W. H. Freeman
 Introduction to the Practice of StatisticsStatisticsISBN:9781319013387Author:David S. Moore, George P. McCabe, Bruce A. CraigPublisher:W. H. Freeman
MATLAB: An Introduction with Applications
Statistics
ISBN:9781119256830
Author:Amos Gilat
Publisher:John Wiley & Sons Inc
Probability and Statistics for Engineering and th...
Statistics
ISBN:9781305251809
Author:Jay L. Devore
Publisher:Cengage Learning
Statistics for The Behavioral Sciences (MindTap C...
Statistics
ISBN:9781305504912
Author:Frederick J Gravetter, Larry B. Wallnau
Publisher:Cengage Learning
Elementary Statistics: Picturing the World (7th E...
Statistics
ISBN:9780134683416
Author:Ron Larson, Betsy Farber
Publisher:PEARSON
The Basic Practice of Statistics
Statistics
ISBN:9781319042578
Author:David S. Moore, William I. Notz, Michael A. Fligner
Publisher:W. H. Freeman
Introduction to the Practice of Statistics
Statistics
ISBN:9781319013387
Author:David S. Moore, George P. McCabe, Bruce A. Craig
Publisher:W. H. Freeman