MATLAB: An Introduction with Applications
6th Edition
ISBN: 9781119256830
Author: Amos Gilat
Publisher: John Wiley & Sons Inc
expand_more
expand_more
format_list_bulleted
Question

Transcribed Image Text:7
FI
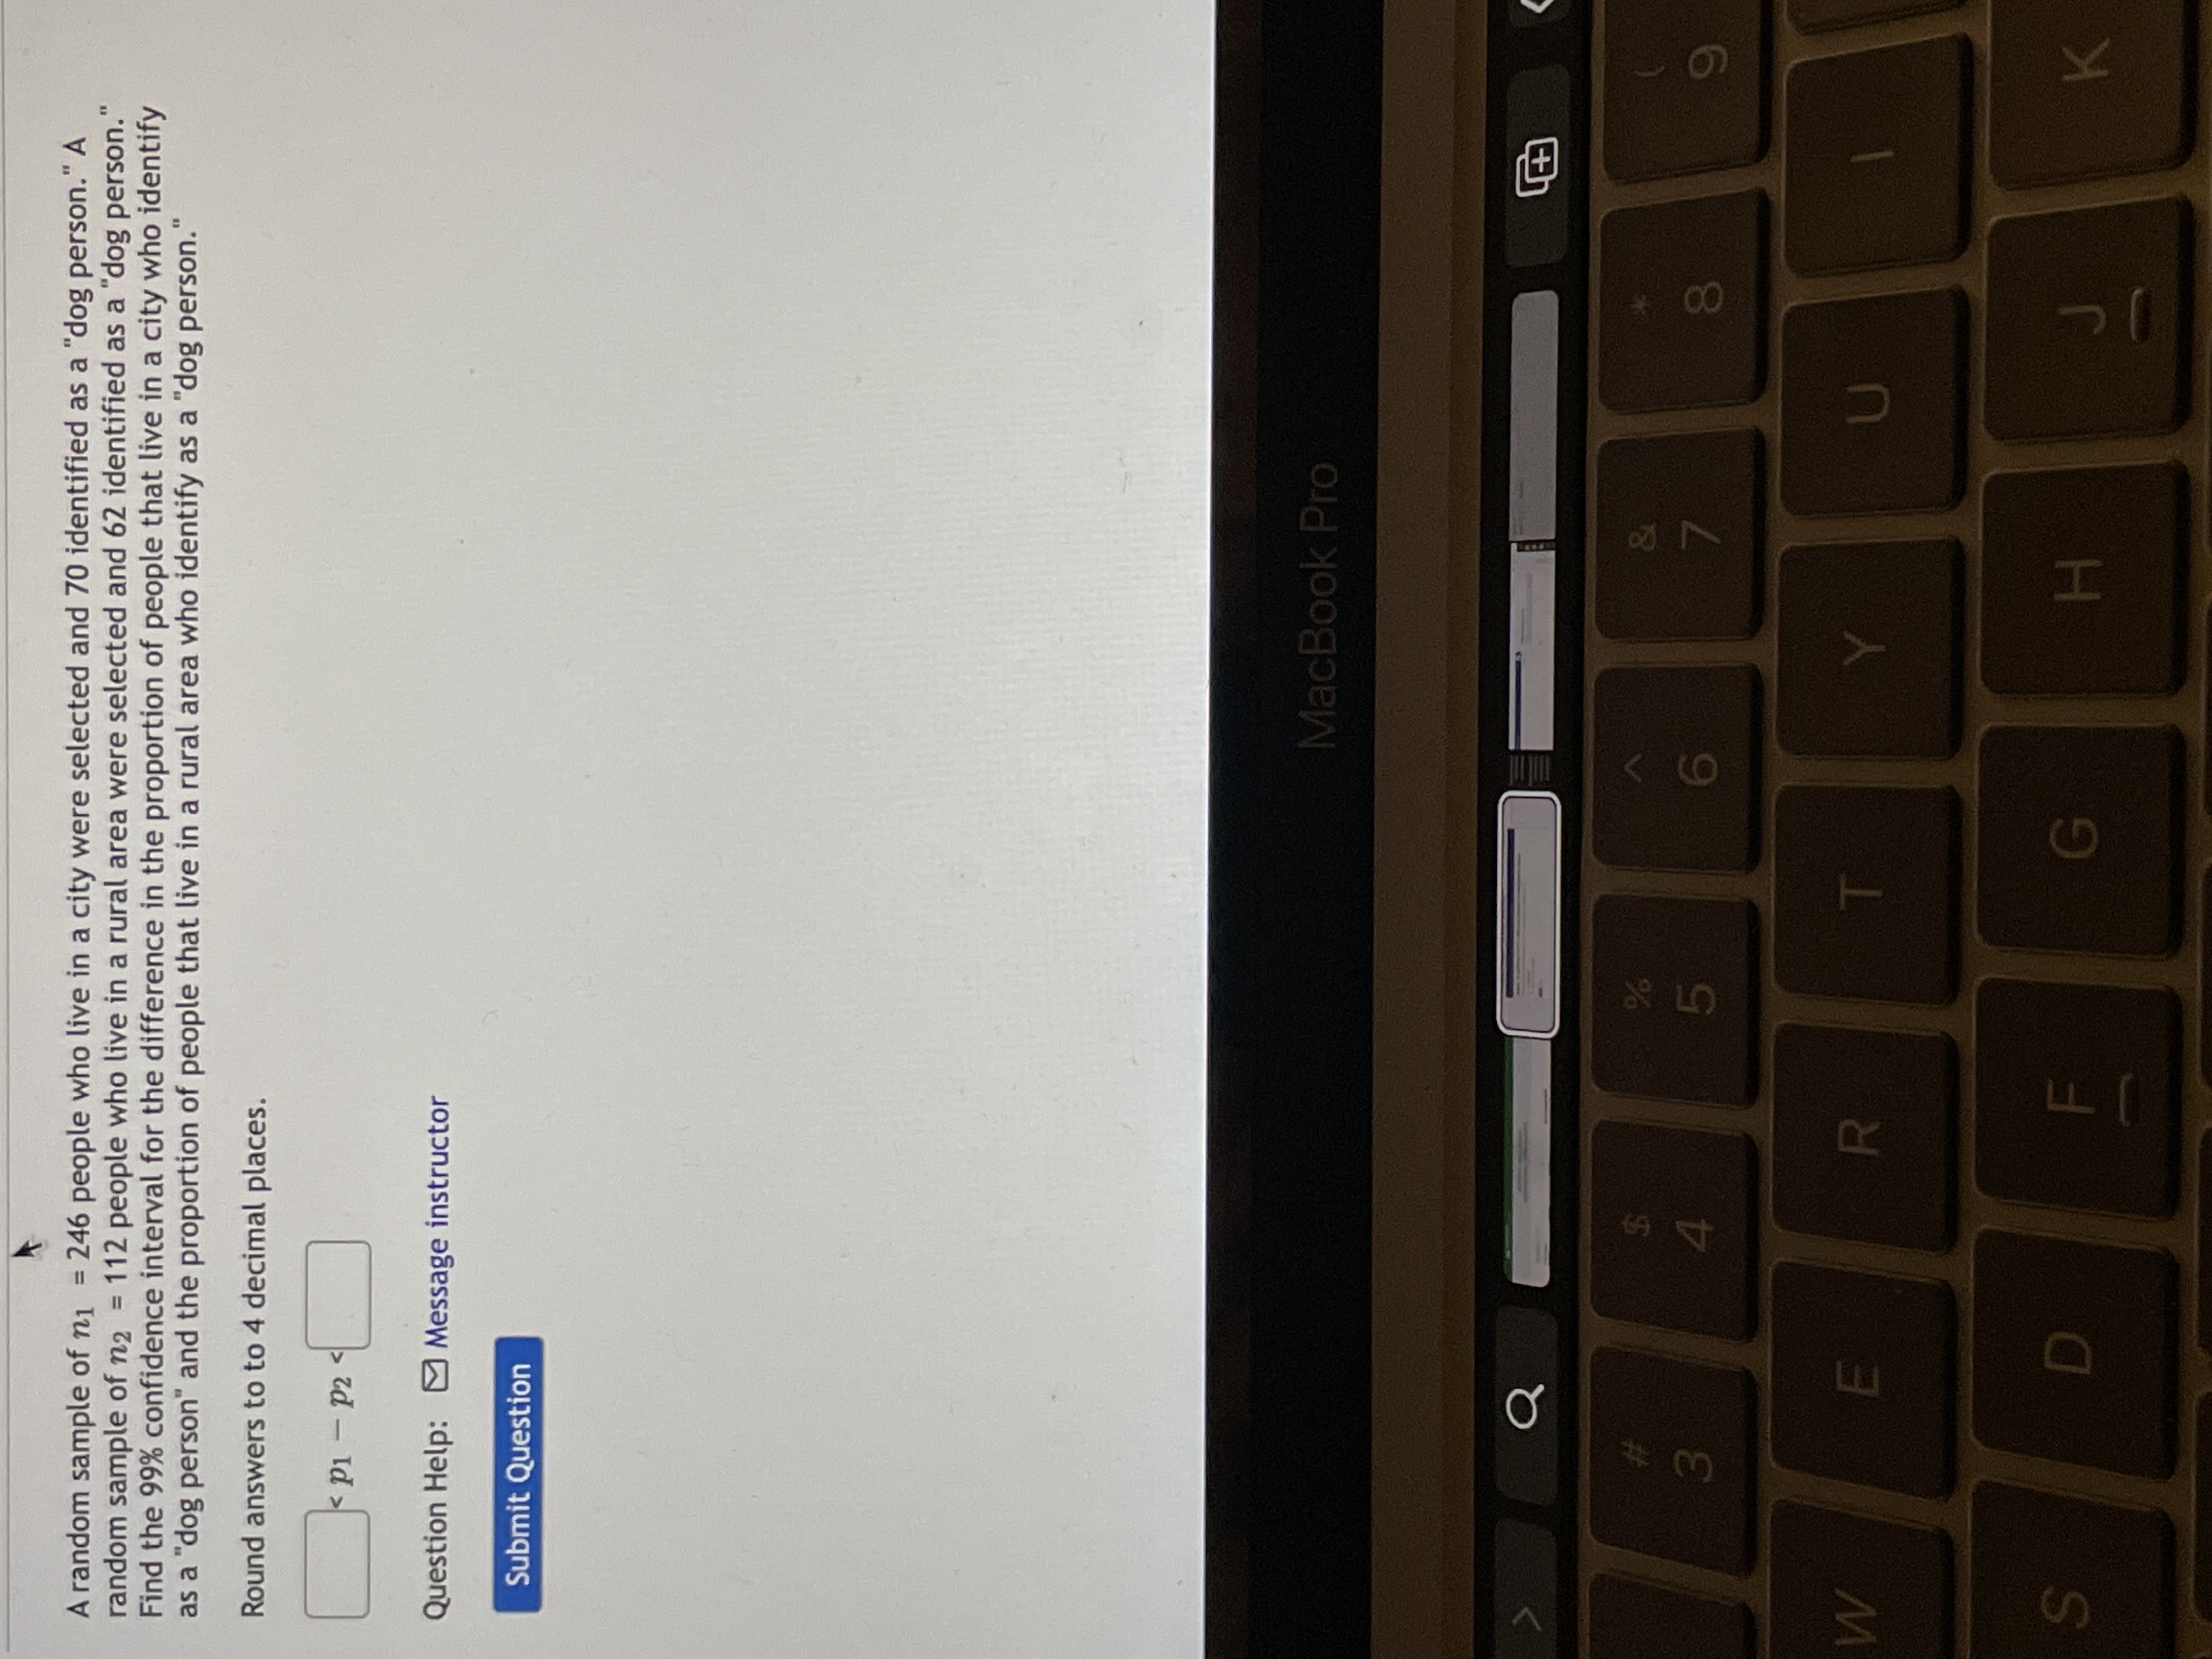
A random sample of ni = 246 people who live in a city were selected and 70 identified as a "dog person." A
random sample of n2
Find the 99% confidence interval for the difference in the proportion of people that live in a city who identify
as a "dog person" and the proportion of people that live in a rural area who identify as a "dog person.'
%3D
112 people who live in a rural area were selected and 62 identified as a "dog person."
%3D
Round answers to to 4 decimal places.
< pi - p2
Id >
Question Help: Message instructor
Submit Question
MacBook Pro
%23
%
3.
00
R.
S.
H.
K.
Expert Solution
This question has been solved!
Explore an expertly crafted, step-by-step solution for a thorough understanding of key concepts.
This is a popular solution
Trending nowThis is a popular solution!
Step by stepSolved in 2 steps with 2 images

Knowledge Booster
Similar questions
- The American Heart Association is about to conduct in anti smoking campaign and wants to know the fraction of Americans over 35 who smoke. Suppose a sample of 1421 Americans over 35 is drawn of these people 412 smoke using the data to construct the 90% confidence interval for the population proportion of Americans over 35 who smoke.arrow_forwardDuring a period of 11 years, of 1700 people that were selected for grand jury duty, 30% of them were immigrants. Construct a 99% confidence interval for the percentage of grand jury members who were immigrants. The 99% confidence interval is from toarrow_forwardIn a random sample, 136 of * persons given a flu vaccine experienced some discomfort. Construct a - % confidence interval for the true proportion of persons who will experience some discomfort from the vaccine. 350 94arrow_forward
- The final grades of students in BC schools were chosen randomly from various classes, namely 77, 80, 87, 84, 55, 63. Create a 95% confidence interval to estimate the standard deviation of students scores in BC schools.arrow_forwardResearchers studying the spread of an insect called the hemlock woolly adelgid find that the bugs have infested 23% of a random sample of 345 hemlock trees in the study area. What's a 99% confidence interval for the population proportion of infested hemlock trees in the study area?arrow_forwardResults from the National Health and Nutrition Examination Survey (NHANES) conducted thirty years ago revealed that out of 378 randomly selected adults in the United States 57 were considered to be obese. In this year’s National Health and Nutrition Examination Survey, out of 426randomly selected adults in the United States 135 were considered to be obese. Use the results of the National Health and Nutrition Examination Survey and a 99% confidence interval to estimate the difference between the percentages of adults in the United States that are obese this year and thirty years ago. Express the estimate both symbolically and verbally.arrow_forward
- of 101 randomly selected mothers, 17% indicated that they pay for private preschool, what is the 99% confidence interval for the proportion of mothers that pay for private preschoolarrow_forwardA random sample of n - 236 people who live in a city were selected and 81 identified as a "dog person." A random sample of n2 - 109 people who live in a rural area were selected and 60 identified as a "dog person." Find the 90% confidence interval for the difference in the proportion of people that live in a city who identify as a "dog person" and the proportion of people that live in a rural area who identify as a "dog person." Round answers to to 4 decimal places. P1 - P2 Question Help: Message instructor Submit Question Jump to Answerarrow_forwardA laboratory tested twelve chicken eggs and found that the mean amount of cholesterol was 226 milligrams withs = 17.9 milligrams. Construct a 98% confidence interval for the true mean cholesterol content of all such eggsarrow_forward
arrow_back_ios
arrow_forward_ios
Recommended textbooks for you
 MATLAB: An Introduction with ApplicationsStatisticsISBN:9781119256830Author:Amos GilatPublisher:John Wiley & Sons Inc
 Probability and Statistics for Engineering and th...StatisticsISBN:9781305251809Author:Jay L. DevorePublisher:Cengage Learning
 Statistics for The Behavioral Sciences (MindTap C...StatisticsISBN:9781305504912Author:Frederick J Gravetter, Larry B. WallnauPublisher:Cengage Learning
 Elementary Statistics: Picturing the World (7th E...StatisticsISBN:9780134683416Author:Ron Larson, Betsy FarberPublisher:PEARSON
 The Basic Practice of StatisticsStatisticsISBN:9781319042578Author:David S. Moore, William I. Notz, Michael A. FlignerPublisher:W. H. Freeman
 Introduction to the Practice of StatisticsStatisticsISBN:9781319013387Author:David S. Moore, George P. McCabe, Bruce A. CraigPublisher:W. H. Freeman

MATLAB: An Introduction with Applications
Statistics
ISBN:9781119256830
Author:Amos Gilat
Publisher:John Wiley & Sons Inc

Probability and Statistics for Engineering and th...
Statistics
ISBN:9781305251809
Author:Jay L. Devore
Publisher:Cengage Learning

Statistics for The Behavioral Sciences (MindTap C...
Statistics
ISBN:9781305504912
Author:Frederick J Gravetter, Larry B. Wallnau
Publisher:Cengage Learning

Elementary Statistics: Picturing the World (7th E...
Statistics
ISBN:9780134683416
Author:Ron Larson, Betsy Farber
Publisher:PEARSON

The Basic Practice of Statistics
Statistics
ISBN:9781319042578
Author:David S. Moore, William I. Notz, Michael A. Fligner
Publisher:W. H. Freeman

Introduction to the Practice of Statistics
Statistics
ISBN:9781319013387
Author:David S. Moore, George P. McCabe, Bruce A. Craig
Publisher:W. H. Freeman