MATLAB: An Introduction with Applications
6th Edition
ISBN: 9781119256830
Author: Amos Gilat
Publisher: John Wiley & Sons Inc
expand_more
expand_more
format_list_bulleted
Question
Q: Provide the null and alternative hypotheses for this analysis.
Ho:
Ha:
Q: Select all the outputs that apply to this analysis.
-Xcrit = 21.92
-tcrit = 2.069
-tcalc = 2.201
-Xcalc = 23
-fcalc = 1.21
-tcrit = 2.201
-fcrit = 3.47
-tcalc = -4.51

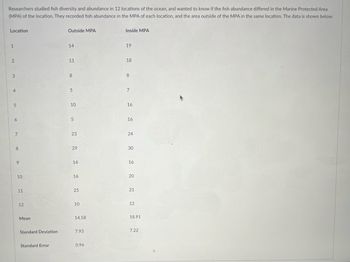
Transcribed Image Text:Researchers studied fish diversity and abundance in 12 locations of the ocean, and wanted to know if the fish abundance differed in the Marine Protected Area
(MPA) of the location. They recorded fish abundance in the MPA of each location, and the area outside of the MPA in the same location. The data is shown below:
Location
1
2
3
4
5
6
7
8
9
10
11
12
Mean
Standard Deviation
Standard Error
Outside MPA
14
11
8
5
10
5
23
29
14
16
25
10
14.58
7.93
0.96
Inside MPA
19
18
8
7
16
16
24
30
16
20
21
12
18.91
7.22
Expert Solution
arrow_forward
Step 1
Given information:
The data is given below,
| Outside MPA | Inside MPA |
| 14 | 19 |
| 11 | 18 |
| 8 | 8 |
| 5 | 7 |
| 10 | 16 |
| 5 | 16 |
| 23 | 24 |
| 29 | 30 |
| 14 | 16 |
| 16 | 20 |
| 25 | 21 |
| 10 | 12 |
(In general)
Step by stepSolved in 2 steps with 3 images

Knowledge Booster
Similar questions
- 8. You collect data on people's height and study the relationship between gender and height. A regression of the height on a binary variable (Female), which takes a value of one for females and zero otherwise, yields the following result: Height = 71.0- 4.84 x Female, R2 = 0.40, SER = 2.0 (0.3) (0.57) (a) What is the sample average male height? (b) What is the sample average female height? I (c) How to interpret the slope coefficient -4.84? (d) Is the error term in the regression more likely to be heteroskedastic or homoscedastic? Why? R English (United States) D'Focus Page 9 of 10 920 words 100%arrow_forwardAn airport official wants to prove that the proportion of delayed flights for Airline A (denoted as p1) is less than the proportion of delayed flights for Airline B (denoted as p2). Random samples for both airlines after a storm showed that 51 out of 200 flights for Airline A were delayed, while 60 out of 200 of Airline B's flights were delayed. The test statistic for this problem is -1.00. The p-value for the test statistic for this problem is: p = 0.0228 p = 0.0668 p = 0.3413 p = 0.1587arrow_forwardThe attached table gives the peak power load for a power plant and the daily high temperature for a random sample of 10 days. (a) Test the hypothesis that the population correlation coefficient between peak power load and high temperature is zero versus the alternative that it is positive. Use = 0:05. (b) What is the minimum absolute value of the sample correlation coefficient that will make the model signicant at 5% level? (c) Find a 98% condence and prediction interval for high temperature of 95. (d) For what value of high temperature the condence interval will be shortest.arrow_forward
- A linear regression model based on a random sample of 36 observations on the response variable and 4 predictors has a multiple coefficient of determination equal to 0.697. What is the value of the adjusted multiple coefficient of determination?arrow_forwardName of the procedure/formula (e.g., ANOVA, Chi-Square, Hypothesis Test using z formula, Regression Analysis, etc.).arrow_forwardA manufacturer of a new medication on the market for Parkinson's disease makes a claim that the medication is effective in 75% of people who have the disease. One hundred fifty individuals with Parkinson's disease are given the medication, and 100 of them note the medication was effective. Does this finding provide statistical evidence at the 0.05 level that the effectiveness is less than the 75% claim the company made? Make sure to include parameter, conditions, calculations, and a conclusion in your answer.arrow_forward
arrow_back_ios
arrow_forward_ios
Recommended textbooks for you
 MATLAB: An Introduction with ApplicationsStatisticsISBN:9781119256830Author:Amos GilatPublisher:John Wiley & Sons Inc
 Probability and Statistics for Engineering and th...StatisticsISBN:9781305251809Author:Jay L. DevorePublisher:Cengage Learning
 Statistics for The Behavioral Sciences (MindTap C...StatisticsISBN:9781305504912Author:Frederick J Gravetter, Larry B. WallnauPublisher:Cengage Learning
 Elementary Statistics: Picturing the World (7th E...StatisticsISBN:9780134683416Author:Ron Larson, Betsy FarberPublisher:PEARSON
 The Basic Practice of StatisticsStatisticsISBN:9781319042578Author:David S. Moore, William I. Notz, Michael A. FlignerPublisher:W. H. Freeman
 Introduction to the Practice of StatisticsStatisticsISBN:9781319013387Author:David S. Moore, George P. McCabe, Bruce A. CraigPublisher:W. H. Freeman

MATLAB: An Introduction with Applications
Statistics
ISBN:9781119256830
Author:Amos Gilat
Publisher:John Wiley & Sons Inc

Probability and Statistics for Engineering and th...
Statistics
ISBN:9781305251809
Author:Jay L. Devore
Publisher:Cengage Learning

Statistics for The Behavioral Sciences (MindTap C...
Statistics
ISBN:9781305504912
Author:Frederick J Gravetter, Larry B. Wallnau
Publisher:Cengage Learning

Elementary Statistics: Picturing the World (7th E...
Statistics
ISBN:9780134683416
Author:Ron Larson, Betsy Farber
Publisher:PEARSON

The Basic Practice of Statistics
Statistics
ISBN:9781319042578
Author:David S. Moore, William I. Notz, Michael A. Fligner
Publisher:W. H. Freeman

Introduction to the Practice of Statistics
Statistics
ISBN:9781319013387
Author:David S. Moore, George P. McCabe, Bruce A. Craig
Publisher:W. H. Freeman