
ENGR.ECONOMIC ANALYSIS
14th Edition
ISBN: 9780190931919
Author: NEWNAN
Publisher: Oxford University Press
expand_more
expand_more
format_list_bulleted
Related questions
Concept explainers
Question
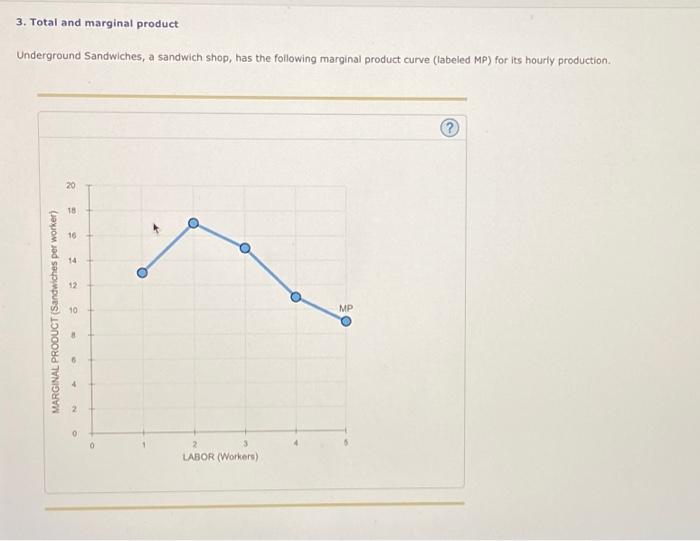

Transcribed Image Text:3. Total and marginal product
Underground Sandwiches, a sandwich shop, has the following marginal product curve (labeled MP) for its hourly production.
MARGINAL PRODUCT (Sandwiches per worker)
20
18
16
14
12
10
8
a
LABOR (Workers)
MP

Transcribed Image Text:When labor Increases from two to three workers, total product increases by
Use the orange points (square symbol) to plot the production function on the following graph. Assume that if there are no workers, Underground
Sandwiches does not have any output.
Note: Plot your points in the order in which you would like them connected. Line segments will connect the points automatically.
9
80
72
04
56
45
40
32
24
16
A
0
QUANTITY OF LABOR (Workers)
-0-
per hour.
Production Function
Expert Solution
This question has been solved!
Explore an expertly crafted, step-by-step solution for a thorough understanding of key concepts.

This is a popular solution

Trending nowThis is a popular solution!

Step by stepSolved in 3 steps with 3 images

Knowledge Booster


Learn more about
Need a deep-dive on the concept behind this application? Look no further. Learn more about this topic, economics and related others by exploring similar questions and additional content below.Similar questions
- Question 24 Consider the following production function when K is fixed. (This is a description of the figure: it shows a two-axis graph; in the horizontal axis we measure labor and in the vertical axis we measure output, in this case articles as in the production function of a newspaper; the graph of the production function, for the given level of capital K fixed, is composed of two line segments; the first goes from the origin to the point (10,30); the second, starting from 10 on, is a horizontal line; it is also shown that the production for five units of labor is 15). Can we say that the production function satisfies the law of decreasing marginal returns of labor?True Falsearrow_forwardFor each of the following terms, provide a definition, a description of how this line looks on a graph, and any significant relationships between the term in question and other terms on this list. (If A is related to B, you only need to discuss the relationship once!) Average Product of Labor Marginal Product of Labor Average Variable Cost Average Fixed Cost Average Total Cost Marginal Costarrow_forwardI am having trouble understanding how to answer the last part of this question. I am providing the work I did on the remainder of the problem to provide context, but the multiple choice question is what I'm stuck on. If you see an error in my previous work that would cause me to have trouble with this last question, please let me know and I will fix it. Thank you!arrow_forward
- Let S represent the amount of steel produced (in tons). Steel production is related to the amount of labor used () and the amount of capital used () by the following function: S- 20 L0 C0.7 In this formula L represents the units of labor input and Cthe units of capital input. Each unit of labor costs $50, and each unit of capital costs $100. (a) Formulate an optimization problem that will determine how much labor and capital are needed in order to produce 50,000 tons of steel at minimum cost. If your answer is zere, enter "p" Min 40 120 s.t. 20 S0000 (b) Solve the optimization problem you formulated in part a. Hint: When using Excel Solver, start with an initial >oand C0 Do not round intermediate calculations. Round your answers to the nearest whole number 2991 2318 Cost S 397448 ide Feedbackarrow_forwardA custom motorcycle company can produce more motorcycles if it has more workers. The company has experimented with hiring workers in teams of four and has come up with the following table relating the number of workers to the companies annual production Part1. Using the straight line tool, graph the production function based on the information given. Construct the curve using four line segments joined end to end. Don it graph the individual points. Part 2. Give the numeric answers to tap decimals. A. The marginal product of each of the first four workers is ______ B. The marginal product of each of the second four workers is _______ C. Diminishing returns begin with the _______ worker.arrow_forwardUnderground Sandwiches, a sandwich shop, has the following marginal product curve (labeled MP) for its hourly production. MARGINAL PRODUCT (Sandwiches per worker) 80 72 64 56 48 40 32 24 m 16 B When labor increases from three to four workers, total product increases by 00 18 8 16 Use the orange points (square symbol) to plot the production function on the following graph. Assume that if there are no workers, Underground Sandwiches does not have any output. 0 12 Note: Plot your points in the order in which you would like them connected. Line segments will connect the points automatically. 9 m 2 0 0 O 2 3 LABOR (Workers) 0 O MP QUANTITY OF LABOR (Workers) 5 per hour. Production Functionarrow_forward
- Suppose the production function for widgets is given by q=kl -0.8k²-0.21² where q represents the annual quantity of widgets produced, k represents annual capital input, and I represents annual labor input. Suppose k = 10; at what level of labor input does this average productivity reach maximum? (please put your answer in numerical values with no comma or decimal place). How many widgets are produced at that point? (please put your answer in numerical values with no comma or decimal place). If k = 10, at what level of labor input does MPL = 0? Suppose capital inputs were increased to k = 20, at what level of labor input does this average productivity reach maximum? widgets are produced at that point? (please put your answer in numerical values with no comma or decimal place). If k = 20, at what level of labor input does MPL = 0? answer in numerical values with no comma or decimal place). Does the widget production function exhibit constant, increasing, or decreasing returns to scale?…arrow_forwardplease show graphs and table thank youarrow_forwardSuppose the production function for widgets is given by: Q = f (K, L) = 2 ∗ KL − K2/2 − L2/2 (a) Suppose L=5 (is fixed), derive an expression for and graph the total product of capital curve (the production function for a fixed level of labor) and the average productivity of capital curve. (b) At what level of capital input does the average productivity reach a maximum? How many widgets are produced at this point? (c) Again, assuming L=5, derive an expression for and graph the MPK curve. At what level of capital input does MPK =0? (d) Does this production function exhibit constant, increasing or decreasing returns to scale?arrow_forward
- /arrow_forwardConsider the production function from earlier: Quantity of Haircuts 20 15 10 0+0 0 N 2 8 14 O Increasing marginal productivity O Constant marginal productivity O Decreasing marginal productivity 3 19 23 Labor (hours) 27 26 Total Product Curve From 1 labor hour up to 7 labor hours, what sort of marginal productivity does this production function have?arrow_forwardThe following equations represent the long-run production functions for four different technologies, where capital and labor are both variable inputs. For each function, indicate whether it exhibits increasing, decreasing, or constant returns to scale. Clearly show your derivations. (Note that in parts a and c, the exponents are decimals.) f(L,K)= 8L²K4 b. f(L,K)= L+7K c. f(L,K)= L³K d. f(L,K)= 4L+K? а. с.arrow_forward
arrow_back_ios
SEE MORE QUESTIONS
arrow_forward_ios
Recommended textbooks for you
 Principles of Economics (12th Edition)EconomicsISBN:9780134078779Author:Karl E. Case, Ray C. Fair, Sharon E. OsterPublisher:PEARSON
 Engineering Economy (17th Edition)EconomicsISBN:9780134870069Author:William G. Sullivan, Elin M. Wicks, C. Patrick KoellingPublisher:PEARSON
 Principles of Economics (MindTap Course List)EconomicsISBN:9781305585126Author:N. Gregory MankiwPublisher:Cengage Learning
 Managerial Economics: A Problem Solving ApproachEconomicsISBN:9781337106665Author:Luke M. Froeb, Brian T. McCann, Michael R. Ward, Mike ShorPublisher:Cengage Learning
 Managerial Economics & Business Strategy (Mcgraw-...EconomicsISBN:9781259290619Author:Michael Baye, Jeff PrincePublisher:McGraw-Hill Education
Principles of Economics (12th Edition)
Economics
ISBN:9780134078779
Author:Karl E. Case, Ray C. Fair, Sharon E. Oster
Publisher:PEARSON
Engineering Economy (17th Edition)
Economics
ISBN:9780134870069
Author:William G. Sullivan, Elin M. Wicks, C. Patrick Koelling
Publisher:PEARSON
Principles of Economics (MindTap Course List)
Economics
ISBN:9781305585126
Author:N. Gregory Mankiw
Publisher:Cengage Learning
Managerial Economics: A Problem Solving Approach
Economics
ISBN:9781337106665
Author:Luke M. Froeb, Brian T. McCann, Michael R. Ward, Mike Shor
Publisher:Cengage Learning
Managerial Economics & Business Strategy (Mcgraw-...
Economics
ISBN:9781259290619
Author:Michael Baye, Jeff Prince
Publisher:McGraw-Hill Education