
MATLAB: An Introduction with Applications
6th Edition
ISBN: 9781119256830
Author: Amos Gilat
Publisher: John Wiley & Sons Inc
expand_more
expand_more
format_list_bulleted
Related questions
Question
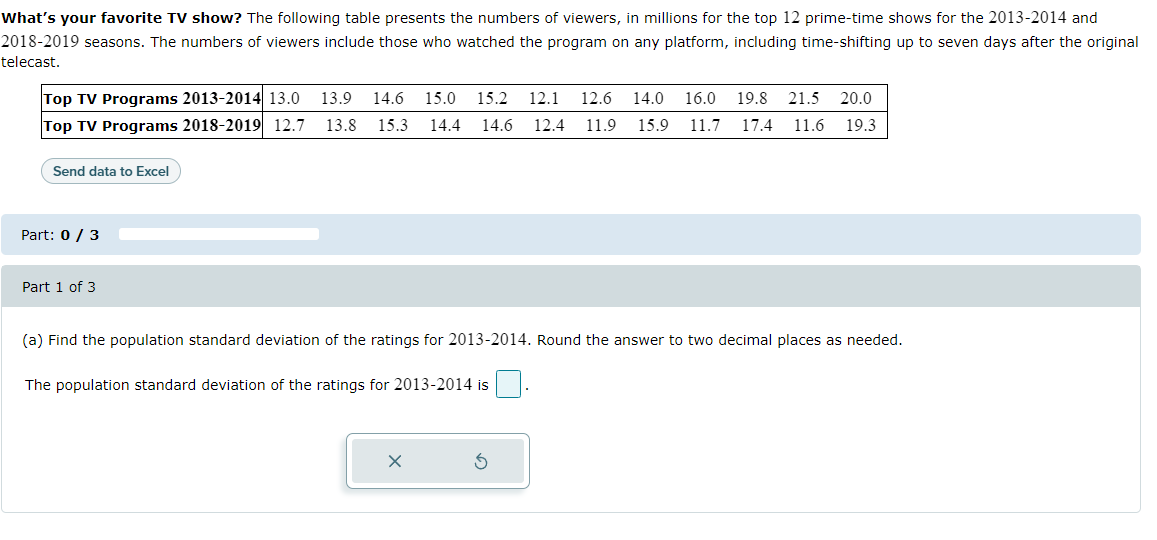

Transcribed Image Text:What's your favorite TV show? The following table presents the numbers of viewers, in millions for the top 12 prime-time shows for the 2013-2014 and
2018-2019 seasons. The numbers of viewers include those who watched the program on any platform, including time-shifting up to seven days after the original
telecast.
Top TV Programs 2013-2014 13.0 13.9 14.6 15.0 15.2 12.1 12.6 14.0 16.0 19.8 21.5 20.0
Top TV Programs 2018-2019 12.7 13.8 15.3 14.4 14.6 12.4 11.9 15.9 11.7 17.4 11.6 19.3
Send data to Excel
Part: 0 / 3
Part 1 of 3
(a) Find the population standard deviation of the ratings for 2013-2014. Round the answer to two decimal places as needed.
The population standard deviation of the ratings for 2013-2014 is
x
Expert Solution
This question has been solved!
Explore an expertly crafted, step-by-step solution for a thorough understanding of key concepts.

This is a popular solution

Trending nowThis is a popular solution!

Step by stepSolved in 3 steps

Knowledge Booster

Similar questions
- CURSED MOVIE Released in 1956, the movie The Conqueror attracted considerable attention because many members of the cast and crew died from cancer supposedly resulting from exposure to radioactive fallout. The movie was shot a short distance from a site in Nevada where above-ground tests of atomic weapons were conducted. Among the 220 cast and crew members, 91 developed cancer. According to the National Cancer Institute, for that time period and for the age cohort, the incidence of cancer was about 40%. Use a 0.05 significance level to test the claim that the sample of cast and crew members is from a population in which the rate of cancer is greater than 40%. What do you conclude about the movie being a curse? Find null hypothesis and alternative hypothesis. Find test statsistic. Find P-value. How do you find p hatarrow_forwardA city official would like to know if there is public support for increasing funding for arts programs. To collect data, the city official stands outside a concert hall after a show and surveys every 25th person to exit and asks their opinion about raising funds for the arts. Which of the following describes the population in this scenario? all residents of the city the members of the city council all city residents who support the arts the people surveyed by the city officialarrow_forwardSeveral years ago, two companies merged. One of the concerns after the merger was the increasing burden of retirement expenditures. An effort was made to encourage employees to participate in the 401(k) accounts. Nationwide, 63% of eligible workers participated in these accounts. The accompanying data table contains responses of 30 employees of the company when asked if they were currently participating in a 401(k) account. Complete parts a through d. Click the icon to view the data table. a. Determine the sample proportion of company workers who participate in 401(k) accounts. The sample proportion is. (Round to three decimal places as needed.) b. Determine the sampling error if in reality the company workers have the same proportion of participants in 401(k) accounts as does the rest of the nation. The error is (Round to three decimal places as needed.) c. Determine the probability that a sample proportion at least as large as that obtained in the sample would be obtained if the…arrow_forward
- Approximately 29% of music lovers like Country Music. Of those who do, 96% do not have mild brain damage. What percent of music lovers like Country and do not have Brain Damage?arrow_forwardThe creator of a new online multiplayer survival game has been tracking the monthly downloads of the game. The following table shows the monthly downloads (in thousands) for each month of the current and previous year. Click on the datafile logo to reference the data. The datafile logo. Month Downloads Month Downloads (previous year) (thousands) (current year) (thousands) February 33.0 January 31.0 March 34.0 February 32.0 April 34.0 March 33.0 May 31.0 April 34.0 June 32.0 May 33.0 July 33.0 June 32.0 August 35.0 July 35.0 September 36.0 August 33.0 October 37.0 September 33.0 November 34.0 October 31.0 December 35.0 a. Compute the mean, median, and mode for number of downloads in the previous year. Mean (to 3 decimals) thousand Median (to 2 decimal) thousand Mode (to 2 decimal) thousand b. Compute the mean, median, and mode for number of downloads in the current year. Mean (to 3 decimals) thousand Median (to 2…arrow_forwardA retailer wants to see if a red "Sale" sign brings in more revenue than the same "Sale" sign in blue. The data below shows the revenue in thousands of dollars that was achieved for various days when the retailer decided to put the red "Sale" sign up and days when the retailer decided to put the blue "Sale" sign up. Red: 2.7, 2.6, 1.1, 4.2, 2.6, 3.4, 2.3, 2.9, 4, 2.6 Blue: 2.2, 1, 2.8, 1.6, 0.6, 0.9, 1, 1.7, 3.4 Assume that both populations follow a normal distribution. What can be concluded at the a = 0.01 level of significance level of significance? b. The test statistic t î = (please show your answer to 3 decimal places.) c. The p-value = (Please show your answer to 4 decimal places.)arrow_forward
- (0.5,3.4),(0.2,3.7),(1.2,5.5),(2.9,7.3),(3.4,7.9),(2.4,5.9),(4.4,8.1),(4.5,7.9),(4.9,7.9),(3.3,6.6) Compute the coefficients of polynomials of degrees 3,4,5,6,7,8,9(3 to 9) that approximates the above data points in the least-square sense using Cholesky factorization.arrow_forwardVirginia polled a large sample of individuals to find the percentage of students with known food allergies and the percentage of students without known food allergies. Which of the following could sufficiently display the data if only the two given categories are to be included? Select the correct answer below: bar graph pie chart either a pie chart or a bar graph neither a pie chart nor a bar grapharrow_forwardAn administrative assistant for the athletics department at a local university is moni- toring the GPAs for eight members of the women's volleyball team. He enters the GPAs into the database but accidentally misplaces the decimal point in the last entry. 2.8 3.0 3.0 3.3 2.4 3.4 3.0 21 Use a dotplot to describe the data and uncover the assistant's mistake.arrow_forward
arrow_back_ios
SEE MORE QUESTIONS
arrow_forward_ios
Recommended textbooks for you
- MATLAB: An Introduction with ApplicationsStatisticsISBN:9781119256830Author:Amos GilatPublisher:John Wiley & Sons Inc
 Probability and Statistics for Engineering and th...StatisticsISBN:9781305251809Author:Jay L. DevorePublisher:Cengage Learning
 Statistics for The Behavioral Sciences (MindTap C...StatisticsISBN:9781305504912Author:Frederick J Gravetter, Larry B. WallnauPublisher:Cengage Learning
  Elementary Statistics: Picturing the World (7th E...StatisticsISBN:9780134683416Author:Ron Larson, Betsy FarberPublisher:PEARSON
 The Basic Practice of StatisticsStatisticsISBN:9781319042578Author:David S. Moore, William I. Notz, Michael A. FlignerPublisher:W. H. Freeman
 Introduction to the Practice of StatisticsStatisticsISBN:9781319013387Author:David S. Moore, George P. McCabe, Bruce A. CraigPublisher:W. H. Freeman
MATLAB: An Introduction with Applications
Statistics
ISBN:9781119256830
Author:Amos Gilat
Publisher:John Wiley & Sons Inc
Probability and Statistics for Engineering and th...
Statistics
ISBN:9781305251809
Author:Jay L. Devore
Publisher:Cengage Learning
Statistics for The Behavioral Sciences (MindTap C...
Statistics
ISBN:9781305504912
Author:Frederick J Gravetter, Larry B. Wallnau
Publisher:Cengage Learning
Elementary Statistics: Picturing the World (7th E...
Statistics
ISBN:9780134683416
Author:Ron Larson, Betsy Farber
Publisher:PEARSON
The Basic Practice of Statistics
Statistics
ISBN:9781319042578
Author:David S. Moore, William I. Notz, Michael A. Fligner
Publisher:W. H. Freeman
Introduction to the Practice of Statistics
Statistics
ISBN:9781319013387
Author:David S. Moore, George P. McCabe, Bruce A. Craig
Publisher:W. H. Freeman