MATLAB: An Introduction with Applications
6th Edition
ISBN: 9781119256830
Author: Amos Gilat
Publisher: John Wiley & Sons Inc
expand_more
expand_more
format_list_bulleted
Question
1

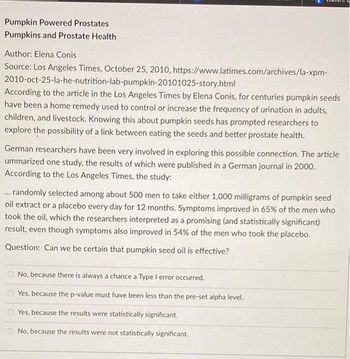
Transcribed Image Text:Pumpkin Powered Prostates
Pumpkins and Prostate Health
Author: Elena Conis
Source: Los Angeles Times, October 25, 2010, https://www.latimes.com/archives/la-xpm-
2010-oct-25-la-he-nutrition-lab-pumpkin-20101025-story.html
According to the article in the Los Angeles Times by Elena Conis, for centuries pumpkin seeds
have been a home remedy used to control or increase the frequency of urination in adults,
children, and livestock. Knowing this about pumpkin seeds has prompted researchers to
explore the possibility of a link between eating the seeds and better prostate health.
German researchers have been very involved in exploring this possible connection. The article
ummarized one study, the results of which were published in a German journal in 2000.
According to the Los Angeles Times, the study:
... randomly selected among about 500 men to take either 1,000 milligrams of pumpkin seed
oil extract or a placebo every day for 12 months. Symptoms improved in 65% of the men who
took the oil, which the researchers interpreted as a promising (and statistically significant)
result, even though symptoms also improved in 54% of the men who took the placebo.
Question: Can we be certain that pumpkin seed oil is effective?
No, because there is always a chance a Type I error occurred.
Yes, because the p-value must have been less than the pre-set alpha level.
Yes, because the results were statistically significant.
No, because the results were not statistically significant.
Expert Solution
This question has been solved!
Explore an expertly crafted, step-by-step solution for a thorough understanding of key concepts.
This is a popular solution
Trending nowThis is a popular solution!
Step by stepSolved in 2 steps

Knowledge Booster
Similar questions
- A student's grade classificaiton (i.e. senior, junior, etc) is considered quantitative. qualitative. both qualitative and quantitative. neither qualitative or quantitative.arrow_forwardPlease answer number 12. Make sure to show work!! Answer all parts!!arrow_forwardDescribe the similarities and differences between a research proposal and a research report.arrow_forward
- Discuss characteristics of academic writing.arrow_forwardSeveral years ago, the state of California launched an aggressive advertisement campaign against smoking. We've interviewed students from 16 college campuses in California and recorded for each campus the percentage of students who stated that they encountered at least one anti-smoking advertisement in the past month. Here are those percentages. 27, 52, 48, 40, 32, 51, 55, 39, 41, 41, 56, 30, 30, 35, 57, 60 Send data to calculator Send data to Excel Using the tool provided, construct a box-and-whisker plot (sometimes called a boxplot) for the data. HH 25 30 35 40 45 50 55 60 Percentage encountering anti-smoking ad Xarrow_forwardI am working on an assignment and I was trying to compare my results with what is given here. https://www.bartleby.com/questions-and-answers/the-sheet-called-housepr-contains-data-on-prices-of-houses-that-have-sold-recently-and-two-attribute/9927f067-cb79-4a9b-85fd-b5fe77442023 I am getting a different Excel output and I cannot figure out why. Can I have some assistance to what I am doing wrong? Or is the solution on here incorrect?arrow_forward
arrow_back_ios
SEE MORE QUESTIONS
arrow_forward_ios
Recommended textbooks for you
 MATLAB: An Introduction with ApplicationsStatisticsISBN:9781119256830Author:Amos GilatPublisher:John Wiley & Sons Inc
 Probability and Statistics for Engineering and th...StatisticsISBN:9781305251809Author:Jay L. DevorePublisher:Cengage Learning
 Statistics for The Behavioral Sciences (MindTap C...StatisticsISBN:9781305504912Author:Frederick J Gravetter, Larry B. WallnauPublisher:Cengage Learning
 Elementary Statistics: Picturing the World (7th E...StatisticsISBN:9780134683416Author:Ron Larson, Betsy FarberPublisher:PEARSON
 The Basic Practice of StatisticsStatisticsISBN:9781319042578Author:David S. Moore, William I. Notz, Michael A. FlignerPublisher:W. H. Freeman
 Introduction to the Practice of StatisticsStatisticsISBN:9781319013387Author:David S. Moore, George P. McCabe, Bruce A. CraigPublisher:W. H. Freeman

MATLAB: An Introduction with Applications
Statistics
ISBN:9781119256830
Author:Amos Gilat
Publisher:John Wiley & Sons Inc

Probability and Statistics for Engineering and th...
Statistics
ISBN:9781305251809
Author:Jay L. Devore
Publisher:Cengage Learning

Statistics for The Behavioral Sciences (MindTap C...
Statistics
ISBN:9781305504912
Author:Frederick J Gravetter, Larry B. Wallnau
Publisher:Cengage Learning

Elementary Statistics: Picturing the World (7th E...
Statistics
ISBN:9780134683416
Author:Ron Larson, Betsy Farber
Publisher:PEARSON

The Basic Practice of Statistics
Statistics
ISBN:9781319042578
Author:David S. Moore, William I. Notz, Michael A. Fligner
Publisher:W. H. Freeman

Introduction to the Practice of Statistics
Statistics
ISBN:9781319013387
Author:David S. Moore, George P. McCabe, Bruce A. Craig
Publisher:W. H. Freeman