ENGR.ECONOMIC ANALYSIS
14th Edition
ISBN: 9780190931919
Author: NEWNAN
Publisher: Oxford University Press
expand_more
expand_more
format_list_bulleted
Question

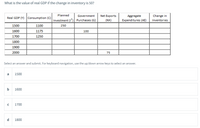
Transcribed Image Text:What is the value of real GDP if the change in inventory is 50?
Planned
Government
Net Exports
Aggregate
Change in
Real GDP (Y) Consumption (C)
Investment (1') Purchases (G)
(NX)
Expenditures (AE)
Inventories
1500
1100
250
1600
1175
100
1700
1250
1800
1900
2000
75
Select an answer and submit. For keyboard navigation, use the up/down arrow keys to select an answer.
a
1500
b
1600
1700
d
1800
Expert Solution
This question has been solved!
Explore an expertly crafted, step-by-step solution for a thorough understanding of key concepts.
This is a popular solution
Trending nowThis is a popular solution!
Step by stepSolved in 3 steps

Knowledge Booster
Learn more about
Need a deep-dive on the concept behind this application? Look no further. Learn more about this topic, economics and related others by exploring similar questions and additional content below.Similar questions
- Refer to the figure below: Insurance and pensions 11.9% Item a. Entertainment b. Transportation c. Clothing Housing 32.8% Item Weight 0.053 0.159 0.03 Entertainment 5.3% Transportation 15.9% Price Change 20% -8% 100% Health care 8.1% Source: U.S. Bureau of Labor Statistics, Consumer Expenditure Survey (2018 data). Use the item weights in the figure to determine the percentage change in the CPI that would result from a(n) a. 20 percent increase in entertainment prices. b. 8 percent decrease in transportation costs. c. doubling of clothing prices. (Note: Review the table titled "Computing Changes in the CPI" in your text for assistance.) Instructions: Enter your responses as a percentage rounded to two decimal places. If you are entering any negative numbers be sure to include a negative sign (-) in front of those numbers. Food 12.9% Impact on CPI (Inflation Effect) Clothing 3.0% Miscellaneous 10.1%arrow_forwardNo written by hand solutionarrow_forward2. Use the data below to do a 3 year and 5 year moving average. Explain what happens to the data. Year Data 1996 92.00 1997 101.00 1998 112.00 1999 124.00 2000 135.00 2001 149.00 2002 163.00 2003 180.00arrow_forward
- The Wall Street Journal’s website, www.wsj.com, reported the number of cars and light-duty trucks sold through October of 2014 and October of 2015. The top sixteen manufacturers are listed here. The sales information for all manufacturers can be accessed in a data file below. Sales data are often reported in this way to compare current sales to last year’s sales. Year-to-Date Sales Manufacturer Through October 2015 Through October 2014 General Motors Corp. 2,562,840 2,434,707 Ford Motor Company 2,178,587 2,065,612 Toyota Motor Sales USA Inc. 2,071,446 1,975,368 Chrysler 1,814,268 1,687,313 American Honda Motor Co Inc. 1,320,217 1,281,777 Nissan North America Inc. 1,238,535 1,166,389 Hyundai Motor America 638,195 607,539 Kia Motors America Inc. 526,024 489,711 Subaru of America Inc. 480,331 418,497 Volkswagen of America Inc. 294,602 301,187 Mercedes-Benz 301,915 281,728 BMW of North America Inc.…arrow_forward1. Key facts about economic fluctuations The graph included below approximates United States business cycles between quarter one of 1953 and quarter three of 1957. The shaded region denotes periods of six or more consecutive months of declining real gross domestic product (real GDP). REAL GDP (Billions of dollars) 2700 2600 2500 2400 2300 1953 1954 1955 1956 1957 (?)arrow_forward1arrow_forward
- Only typed answerarrow_forwardEach term (3 months) the current group of economics students completed a questionnaire as to how much they would spend on new purchases compared to how much they would save/pay off bills, if they suddenly and unexpectedly received a check for $1,000. The average MPC is shown in the table below. Month in which student poll was taken Average of students’ responses as MPC March 0.41 June 0.30 September 0.22 December 0.56 What do these MPC’s imply about the students’ thinking over the course of the year? (Enter response here.) What is likely happening in the economy during the same period of time?arrow_forwardhelp please answer in text form with proper workings and explanation for each and every part and steps with concept and introduction no AI no copy paste remember answer must be in proper format with all workingarrow_forward
arrow_back_ios
SEE MORE QUESTIONS
arrow_forward_ios
Recommended textbooks for you

 Principles of Economics (12th Edition)EconomicsISBN:9780134078779Author:Karl E. Case, Ray C. Fair, Sharon E. OsterPublisher:PEARSON
 Engineering Economy (17th Edition)EconomicsISBN:9780134870069Author:William G. Sullivan, Elin M. Wicks, C. Patrick KoellingPublisher:PEARSON
 Principles of Economics (MindTap Course List)EconomicsISBN:9781305585126Author:N. Gregory MankiwPublisher:Cengage Learning
 Managerial Economics: A Problem Solving ApproachEconomicsISBN:9781337106665Author:Luke M. Froeb, Brian T. McCann, Michael R. Ward, Mike ShorPublisher:Cengage Learning
 Managerial Economics & Business Strategy (Mcgraw-...EconomicsISBN:9781259290619Author:Michael Baye, Jeff PrincePublisher:McGraw-Hill Education


Principles of Economics (12th Edition)
Economics
ISBN:9780134078779
Author:Karl E. Case, Ray C. Fair, Sharon E. Oster
Publisher:PEARSON

Engineering Economy (17th Edition)
Economics
ISBN:9780134870069
Author:William G. Sullivan, Elin M. Wicks, C. Patrick Koelling
Publisher:PEARSON

Principles of Economics (MindTap Course List)
Economics
ISBN:9781305585126
Author:N. Gregory Mankiw
Publisher:Cengage Learning

Managerial Economics: A Problem Solving Approach
Economics
ISBN:9781337106665
Author:Luke M. Froeb, Brian T. McCann, Michael R. Ward, Mike Shor
Publisher:Cengage Learning

Managerial Economics & Business Strategy (Mcgraw-...
Economics
ISBN:9781259290619
Author:Michael Baye, Jeff Prince
Publisher:McGraw-Hill Education