
ENGR.ECONOMIC ANALYSIS
14th Edition
ISBN: 9780190931919
Author: NEWNAN
Publisher: Oxford University Press
expand_more
expand_more
format_list_bulleted
Related questions
Question
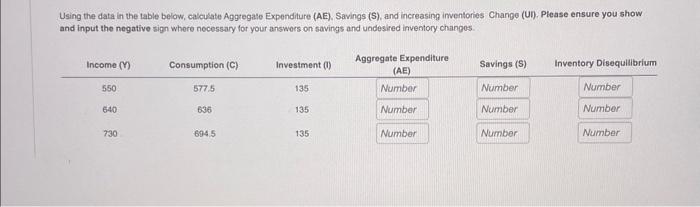

Transcribed Image Text:Using the data in the table below, calculate Aggregate Expenditure (AE), Savings (S), and increasing inventories Change (UI). Please ensure you show
and input the negative sign where necessary for your answers on savings and undesired inventory changes.
Aggregate Expenditure
(AE)
Number
Number
Number
Income (Y)
550
640
730
Consumption (C)
577.5
636
694.5
Investment (1)
135
135
135
Savings (S)
Number
Number
Number
Inventory Disequilibrium
Number
Number
Number
Expert Solution
This question has been solved!
Explore an expertly crafted, step-by-step solution for a thorough understanding of key concepts.

Step by stepSolved in 3 steps with 1 images

Knowledge Booster


Learn more about
Need a deep-dive on the concept behind this application? Look no further. Learn more about this topic, economics and related others by exploring similar questions and additional content below.Similar questions
- Please help me with this question,i really need help,if u help me,i will be very very appreciate!!Please help me with this question,i really need help,if u help me,i will be very very appreciate!!arrow_forwardGiven the following income, spending, and savings data, please answer parts a-g below : Disposable Income (DI) Consumption (C) Savings (S) $ 0 $. 40000 _________ $100000 $100000 _________ $200000 $160000 _________ $300000 $220000 _________ $400000 $280000 _________ a. Solve for savings at each level of disposable income (DI). b. Solve for the marginal propensity to consume (MPC) and the marginal propensity to save (MPS) between each disposable income level. c. Solve for the average propensity to consumer (APC) and the average propensity to save (APS) at each level of disposable income. d. State the numerical value for the break-even level of disposable income in this example. e. State the numerical value for the autonomous consumption in this example. f. Using the data from the table, graph the consumption line. g. Using the data from the table, graph the savings line. Give me answer part: A ,B ,Carrow_forwardY = C + /+ G Y = 5,000 (: G = 1,000 T = 1,000 (· C = 350+0.75(Y – T) (: | | = 1,000-50r Question Find total consumption expenditure and disposable income of household.arrow_forward
- Solve it correctly please. I will rate accordingly.arrow_forwardAggregate saving (in billions SA 25 0 -100 -200 S 400 800 900 Y Aggregate income (in billions) d) From the graph above, calculate the MPS for the saving function.arrow_forwardWork out this questions An animal herder produces 300 litres of milk each year. He sells 160 litres to his neighbours and stocks 140 litres for his own consumption. Which figure should be included in household consumption: 160 litres or 300 litres?arrow_forward
- Calculate the value of outputarrow_forwardPlease give me correct answer with calculation otherwise i give multiple downvote Note:- Please avoid using ChatGPT and refrain from providing handwritten solutions; otherwise, I will definitely give a downvote. Also, be mindful of plagiarism. Answer completely and accurate answer. Rest assured, you will receive an upvote if the answer is accurate.arrow_forwardSub : EconomicsPls answer very fast.I ll upvote correct answer. Thank Youarrow_forward
- The answer should be typed.arrow_forward4) Listen Consumption per period (billions of dollars) 券 $1,600 1,400 Consumption 1,200 శ్రీఎనాలడ్ =శ 1,000 800 400 200 $400 800 1,200 1,600 2,000 2,400 Disposable personal income per period (billions of dollars) Reference: Ref 11(26)-3 Figure: Consumption and Disposable Personal Income (Figure: Consumption and Disposable Personal Income) Use Figure: Consumption and Disposable Personal Income. When disposable personal income is $2,000 billion, consumption is billion.arrow_forwardAggregate Variables Value (in billions of dollars) in the base year Consumption spending $900 Investment spending $400 Government spending $200 Transfer payments $60 The marginal propensity to save is equal to 0.4 and there are no exports or imports, (a) Calculate the real GDP in this country, Show your work (b) Calculate the marginal propensity to consume Show your work. (c) Suppose that the government increases spending from $200 billion to $300 billion (i) Calculate the maximum change in real GDP. Show your work (ii) Given the change in real GDP in part (c)(i), calculate the maximum level of the new equilibrium real GDP. Show your work (d) Suppose that taxes decrease by $100 billion. Will the maximum change in real GDP be larger than, smaller than, or equal to the change in part (c)(i)? Explain.arrow_forward
arrow_back_ios
SEE MORE QUESTIONS
arrow_forward_ios
Recommended textbooks for you
 Principles of Economics (12th Edition)EconomicsISBN:9780134078779Author:Karl E. Case, Ray C. Fair, Sharon E. OsterPublisher:PEARSON
 Engineering Economy (17th Edition)EconomicsISBN:9780134870069Author:William G. Sullivan, Elin M. Wicks, C. Patrick KoellingPublisher:PEARSON
 Principles of Economics (MindTap Course List)EconomicsISBN:9781305585126Author:N. Gregory MankiwPublisher:Cengage Learning
 Managerial Economics: A Problem Solving ApproachEconomicsISBN:9781337106665Author:Luke M. Froeb, Brian T. McCann, Michael R. Ward, Mike ShorPublisher:Cengage Learning
 Managerial Economics & Business Strategy (Mcgraw-...EconomicsISBN:9781259290619Author:Michael Baye, Jeff PrincePublisher:McGraw-Hill Education
Principles of Economics (12th Edition)
Economics
ISBN:9780134078779
Author:Karl E. Case, Ray C. Fair, Sharon E. Oster
Publisher:PEARSON
Engineering Economy (17th Edition)
Economics
ISBN:9780134870069
Author:William G. Sullivan, Elin M. Wicks, C. Patrick Koelling
Publisher:PEARSON
Principles of Economics (MindTap Course List)
Economics
ISBN:9781305585126
Author:N. Gregory Mankiw
Publisher:Cengage Learning
Managerial Economics: A Problem Solving Approach
Economics
ISBN:9781337106665
Author:Luke M. Froeb, Brian T. McCann, Michael R. Ward, Mike Shor
Publisher:Cengage Learning
Managerial Economics & Business Strategy (Mcgraw-...
Economics
ISBN:9781259290619
Author:Michael Baye, Jeff Prince
Publisher:McGraw-Hill Education