
Human Anatomy & Physiology (11th Edition)
11th Edition
ISBN: 9780134580999
Author: Elaine N. Marieb, Katja N. Hoehn
Publisher: PEARSON
expand_more
expand_more
format_list_bulleted
Related questions
Concept explainers
Question
Q2: What is the maximum initial reaction rate for this enzyme at pH 7?

Transcribed Image Text:### Effect of pH and Amount of Substrate
In scientific experiments, it is essential to observe how various conditions affect reactions or behaviors. The following table represents the interaction between pH levels and the amount of substrate, illustrating the results in numeric values.
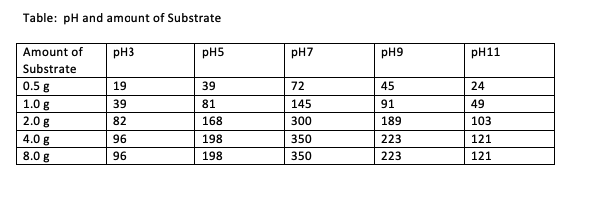
**Table: pH and Amount of Substrate**
| Amount of Substrate | pH 3 | pH 5 | pH 7 | pH 9 | pH 11 |
|---------------------|------|------|------|------|-------|
| 0.5 g | 19 | 39 | 72 | 45 | 24 |
| 1.0 g | 39 | 81 | 145 | 91 | 49 |
| 2.0 g | 82 | 168 | 300 | 189 | 103 |
| 4.0 g | 96 | 198 | 350 | 223 | 121 |
| 8.0 g | 96 | 198 | 350 | 223 | 121 |
#### Explanation:
1. **Column Headers**: Each column header indicates the pH level.
2. **Row Headers**: Each row header represents the amount of substrate (in grams).
3. **Table Data**: The numbers in the table indicate the results observed for different combinations of pH levels and substrate amounts. For instance, at pH 7 and with 2.0 grams of substrate, a value of 300 is observed.
### Analysis:
- **pH Variation**: The values generally increase with the amount of substrate for each respective pH level.
- **Substrate Influence**: Higher substrate amounts show an upward trend in observed values until 4.0 grams, where further increases (at 8.0 grams) do not lead to higher observations and remain constant.
This tabular data helps in understanding the relationship between substrate quantity and pH levels in various experimental setups. Such a table is essential for learners to comprehend how different variables interact in scientific studies.
Expert Solution
This question has been solved!
Explore an expertly crafted, step-by-step solution for a thorough understanding of key concepts.

Step by stepSolved in 3 steps

Knowledge Booster


Learn more about
Need a deep-dive on the concept behind this application? Look no further. Learn more about this topic, biology and related others by exploring similar questions and additional content below.Similar questions
- Q26: Which of the following is an exergonic reaction?O synthesis of ATP from ADP and eiO a dehydration reaction between two monosaccharides to preduce a dischardeO formation of a peptide bondO hydrolysis of glycogen to release glucose monomersarrow_forwardStrategies to Regular Enzyme Activity: Give an example of an enzyme that uses the strategy shown and describe how the activity of the enzyme is regulated. Regulatory Strategy 1. Covalent Modification 2. Feedback Inhibition 3. Cascade of Reaction Enzyme Describe how the regulatory strategy is employedarrow_forwarda) What is cross linking? Write down its advantages and disadvantages.arrow_forward
- =display&toolld3calendar-mybb, Gmail YouTube Maps calendar-tool Home Courses C A Question Completion Status: 20 3D 70 100| 11凸|12D|| 130 14 150 16 170 QUESTION 14 A newly isolated bacterial isocitrate dehydrogenase is found to have a molecular mass of 180KDA and SDS-PAGE shows it to be a homodimer. 1mg of enzyme produces 0.05 mmoles of product per minute per mL. What is the turnover number of this enzyme in µmol product produced per pmol of enzyme subunit per mL? O a. 4.5 Ob.4500 O c. 9000 O d.9 QUESTION 15 The absorption spectrum of NAD" and its reduced form NADH are shown below: Absorption 2,4 2,0 1,6 Click Save and Submit to save and submit. Click Save All Answers to save all answers. Save All Ar 8 11 JAN 9. tv W ... LOarrow_forward2. Enzyme-catalyzed reactions. Answer the following with true or false. If false, explain why. (a) The initial rate of an enzyme-catalyzed reaction is independent of substrate concentration. (b) At saturating levels of substrate, the rate of an enzyme-catalyzed reaction is proportional to the enzyme concentration. (c) The Michaelis constant Km equals the substrate concentration at which velocity (v) = Vmax/2. (d) The Km for a regulatory enzyme varies with enzyme concentration. (e) If enough substrate is added, the normal Vmax of an enzyme-catalyzed reaction can be attained even in the presence of a noncompetitive inhibitor. (f) The Km of some enzymes may be altered by the presence of metabolites structurally unrelated to the substrate. (g) The rate of an enzyme-catalyzed reaction in the presence of a rate-limiting concentration of substrate decreases with time. (h) The sigmoidal shape of the v versus [S] curve for some regulatory enzymes indicates that affinity of the enzyme for the…arrow_forwardQ6: The answer bank for each is: (Pick one that fits best for each)- lyase- transferase- ligase- isomerase- oxidoreductase- hydrolasearrow_forward
- Indicate the hinge region, GK kinaseselectivity pocket and explain "Solvent AccessibilitySurface" and indicate the salt forming group at ATPbinding sitearrow_forwardA1 Calculate the ATP yield for the complete oxidation of oleate.arrow_forwardAn uncatalyzed reaction progresses at a rate of 20micromoles per minute while the same reaction in the presence of an enzyme progresses at a rate of 100micromoles per second. What is the rate enhancement achieved by the presence of the enzyme? At 25oC, how much energy is required to produce a 10-fold rate enhancement? At the same temperature, how much energy is required to produce a million-fold rate acceleration?arrow_forward
arrow_back_ios
arrow_forward_ios
Recommended textbooks for you
- Human Anatomy & Physiology (11th Edition)BiologyISBN:9780134580999Author:Elaine N. Marieb, Katja N. HoehnPublisher:PEARSON
 Biology 2eBiologyISBN:9781947172517Author:Matthew Douglas, Jung Choi, Mary Ann ClarkPublisher:OpenStax
 Anatomy & PhysiologyBiologyISBN:9781259398629Author:McKinley, Michael P., O'loughlin, Valerie Dean, Bidle, Theresa StouterPublisher:Mcgraw Hill Education,
  Molecular Biology of the Cell (Sixth Edition)BiologyISBN:9780815344322Author:Bruce Alberts, Alexander D. Johnson, Julian Lewis, David Morgan, Martin Raff, Keith Roberts, Peter WalterPublisher:W. W. Norton & Company
 Laboratory Manual For Human Anatomy & PhysiologyBiologyISBN:9781260159363Author:Martin, Terry R., Prentice-craver, CynthiaPublisher:McGraw-Hill Publishing Co.
 Inquiry Into Life (16th Edition)BiologyISBN:9781260231700Author:Sylvia S. Mader, Michael WindelspechtPublisher:McGraw Hill Education
Human Anatomy & Physiology (11th Edition)
Biology
ISBN:9780134580999
Author:Elaine N. Marieb, Katja N. Hoehn
Publisher:PEARSON
Biology 2e
Biology
ISBN:9781947172517
Author:Matthew Douglas, Jung Choi, Mary Ann Clark
Publisher:OpenStax
Anatomy & Physiology
Biology
ISBN:9781259398629
Author:McKinley, Michael P., O'loughlin, Valerie Dean, Bidle, Theresa Stouter
Publisher:Mcgraw Hill Education,
Molecular Biology of the Cell (Sixth Edition)
Biology
ISBN:9780815344322
Author:Bruce Alberts, Alexander D. Johnson, Julian Lewis, David Morgan, Martin Raff, Keith Roberts, Peter Walter
Publisher:W. W. Norton & Company
Laboratory Manual For Human Anatomy & Physiology
Biology
ISBN:9781260159363
Author:Martin, Terry R., Prentice-craver, Cynthia
Publisher:McGraw-Hill Publishing Co.
Inquiry Into Life (16th Edition)
Biology
ISBN:9781260231700
Author:Sylvia S. Mader, Michael Windelspecht
Publisher:McGraw Hill Education