MATLAB: An Introduction with Applications
6th Edition
ISBN: 9781119256830
Author: Amos Gilat
Publisher: John Wiley & Sons Inc
expand_more
expand_more
format_list_bulleted
Question
thumb_up100%

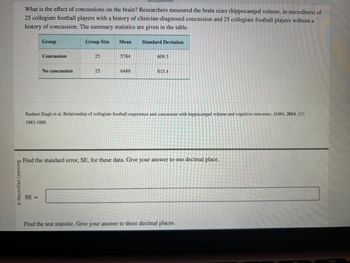
Transcribed Image Text:O Macmillan Learning
What is the effect of concussions on the brain? Researchers measured the brain sizes (hippocampal volume, in microliters) of
25 collegiate football players with a history of clinician-diagnosed concussion and 25 collegiate football players without a
history of concussion. The summary statistics are given in the table.
Group
Concussion
SE=
No concussion
Group Size
25
25
Mean Standard Deviation
5784
6489
609.3
815.4
Rashmi Singh et al. Relationship of collegiate football experience and concussion with hippocampal volume and cognitive outcomes. JAMA. 2014, 311,
1883-1888.
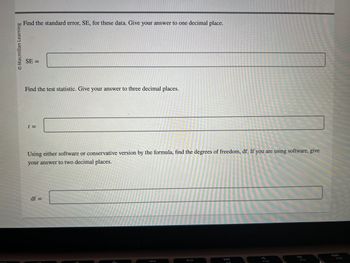
Find the standard error, SE, for these data. Give your answer to one decimal place.
Find the test statistic. Give your answer to three decimal places.
Expert Solution
This question has been solved!
Explore an expertly crafted, step-by-step solution for a thorough understanding of key concepts.
This is a popular solution
Step 1: Determine the given variables.
VIEW Step 2: Develop hypotheses for the test.
VIEW Step 3: Find SE
VIEW Step 4: Find the test statistic.
VIEW Step 5: Find the degree of freedom.
VIEW Step 6: Find the p value.
VIEW Step 7: Give the decision rule and interpret the conclusion.
VIEW Solution
VIEW Trending nowThis is a popular solution!
Step by stepSolved in 8 steps with 14 images

Knowledge Booster
Similar questions
- A credit score is used by credit agencies (such as mortgage companies and banks) to assess the creditworthiness of individuals. Values range from 300 to 850, with a credit score over 700 considered to be a quality credit risk. According to a survey, the mean credit score is 707.9. A credit analyst wondered whether high-income individuals (incomes in excess of $100,000 per year) had higher credit scores. He obtained a random sample of 34 high-income individuals and found the sample mean credit score to be 721.5 with a standard deviation of 80.9. Conduct the appropriate test to determine if high-income individuals have higher credit scores at the α=0.05 level of significance.arrow_forwardIs narcissism a more common personality trait today than it was a few decades ago? It is known that the mean population score on the Narcissistic Personality Inventory (NPI) for students attending University of South Alabama around 20 years ago was μ= 15 (Twenge, 2010). Interested in the narcissism levels of students in the year 2020, a researcher administers the NPI to a random sample of 25 University of Alabama sophomores this Spring term. The mean NPI score from the researcher’s sample of sophomores is M = 16.5, with s = 3.4. 1. Find the obtained (i.e., computed) test statistic for a sample (n=25) with a mean of 16.5 2. Make a statistical decision about the null. Will you reject or fail to reject the null based on your sample data? 3. Justify your decision about the null.arrow_forwardThe Ministry of Education has commissioned a study to determine students’ reading ability based on the level of illumination they were given for the type of reading material. The results of the trial are given below: 1. Conduct the appropriate statistical analyses to compare the reading ability for the two types of reading material while controlling for level of illumination. Clearly outline all your tests.2. What is your conclusion? 3. Has the assumptions of normality and homogeneity of variance been met? (Quote relevant statistics in your response and provide the necessary hypotheses)4. The JASP output and input of all the statistical analyses performed PLEASE INSERT ALL CALCULATIONS USING JASP SOFTWAREarrow_forward
- The table below summarizes baseline characteristics of patients participating in a clinical trial. a) Are there any statistically significant differences in baseline characteristics between treatment groups? Justify your answer. Characteristic Placebo (n = 125) Experimental ( n =125) P Mean (+ Sd. Age 54 + 4.5 53 + 4.9 0.7856 % Female 39% 52% 0.0289 % Less than High School Education 24% 22% 0.0986 % Completing High School 37% 36% % Completing Some College 39% 42% Mean (+ Sd. Systolic Blood Pressure 136 + 13.8 134 + 12.4 0.4736 Mean (+ Sd. Total Cholesterol 214 + 24.9 210 + 23.1 0.8954 % Current Smokers 17% 15% 0.5741 % with Diabetes 8% 3% 0.0438arrow_forwardWhich is not one of the major assumptions typically associated with parametric tests of significance? A. Random Selection B. Homogeneity of Variance C. Absence of restricted rangesarrow_forwardIn a study examining the relationship between socioeconomic status (SES) and academic achievement among high school students, the researchers collected data on 500 students from varying SES backgrounds. The SES was categorized into low, medium, and high. The academic achievement was measured using GPA scores. The following descriptive statistics were obtained: Mean GPA for low SES students: 2.8 Standard deviation of GPA for low SES students: 0.5 Mean GPA for medium SES students: 3.5 Standard deviation of GPA for medium SES students: 0.3 Mean GPA for high SES students: 4.0 Standard deviation of GPA for high SES students: 0.2 a) Calculate the coefficient of variation for each SES group and interpret the results.arrow_forward
- A credit score is used by credit agencies (such as mortgage companies and banks) to assess the creditworthiness of individuals. Values range from 300 to 850 with a credit score over 700 considered to be a quality credit risk. According to a survey, the mean credit score is 705.6. A credit analyst wondered whether high-income individuals (incomes in excess of $100,000 per year) had higher credit scores. He obtained a random sample of 34 high-income individuals and found the sample mean credit score to be 724.4 with a standard deviation of 84.4. Conduct the appropriate test to determine if high-income individuals have higher credit scores at the α=0.05 level of significance. 1) Find: P-value 2) Make a conclusion regarding the hypothesis.arrow_forwardOsteoporosis is a condition in which the bones become brittle due to loss of minerals. To diagnose osteoporosis, an elaborate apparatus measures bone mineral density (BMD). BMD is usually reported in standardized form. The standardization is based on a population of healthy young adults. The World Health Organization (WHO) criterion for osteoporosis is a BMD 2.5 standard deviations below the mean for young adults. BMD measurements in a population of people similar in age and sex roughly follow a Normal distribution. What percent of healthy young adults have osteoporosis by the WHO criterion? Give your answer to two decimal places.arrow_forwardListed below are the lead concentrations in different Ayurveda medicines. Ayurveda is a traditional medical system commonly used in India. The lead concentrations listed here are from medicines manufactured in the United States. Use a significance level to test the claim that the mean lead concentration for all such medicines is less than 14. 3.0,6.5,6.0,5.5,20.5,7.5,12.0,20.5,11.5,17.5arrow_forward
- Nutrition Iron-deficiency anemia is an important nutritional health problem in the United States. A dietary assessment was performed on 56 boys 9 to 11 years of age whose families were below the poverty level. The mean daily iron intake among these boys was found to be 12.40 mg with standard deviation 4.71 mg. Suppose the mean daily iron intake among a large population of 9- to 11-year-old boys from all income strata is 14.41 mg. We want to test whether the mean iron intake among the low-income group is different from that of the general population. You can use the Inferential Statistics page and the Distribution Calculators page in SALT to answer parts of this question. (a) State the hypotheses (in mg) that we can use to consider this question. (Enter != for as needed.) Ho: H₁: (b) Carry out the hypothesis test in part (a) using the critical-value method with an a level of 0.05, and summarize your findings. Find the test statistic. (Round your answer to two decimal places.) Find the…arrow_forwardIs narcissism a more common personality trait today than it was a few decades ago? It is known that the mean population score on the Narcissistic Personality Inventory (NPI) for students attending University of South Alabama around 20 years ago was μ= 15 (Twenge, 2010). Interested in the narcissism levels of students in the year 2020, a researcher administers the NPI to a random sample of 25 University of Alabama sophomores this Spring term. The mean NPI score from the researcher’s sample of sophomores is M = 16.5, with s = 3.4. 1. Write the null and alternative hypotheses in symbols. Possible symbols for your answer: H0, H1, μ, M, σ. 2. Calculate the standard error. 3. Find the critical value for the test statistic, assuming alpha = .05 (Use largest [i.e., most conservative] value if exact value not given in the chart) a) 2.064 b) 1.96 c) 1.98 d) 2.000arrow_forwardWhich measure of central tendency would be the most appropriate for this set of data? (3, 8, 1, 6, 3, 4, 11, 3, 4, 3, 5) mode variance mean medianarrow_forward
arrow_back_ios
SEE MORE QUESTIONS
arrow_forward_ios
Recommended textbooks for you
 MATLAB: An Introduction with ApplicationsStatisticsISBN:9781119256830Author:Amos GilatPublisher:John Wiley & Sons Inc
 Probability and Statistics for Engineering and th...StatisticsISBN:9781305251809Author:Jay L. DevorePublisher:Cengage Learning
 Statistics for The Behavioral Sciences (MindTap C...StatisticsISBN:9781305504912Author:Frederick J Gravetter, Larry B. WallnauPublisher:Cengage Learning
 Elementary Statistics: Picturing the World (7th E...StatisticsISBN:9780134683416Author:Ron Larson, Betsy FarberPublisher:PEARSON
 The Basic Practice of StatisticsStatisticsISBN:9781319042578Author:David S. Moore, William I. Notz, Michael A. FlignerPublisher:W. H. Freeman
 Introduction to the Practice of StatisticsStatisticsISBN:9781319013387Author:David S. Moore, George P. McCabe, Bruce A. CraigPublisher:W. H. Freeman

MATLAB: An Introduction with Applications
Statistics
ISBN:9781119256830
Author:Amos Gilat
Publisher:John Wiley & Sons Inc

Probability and Statistics for Engineering and th...
Statistics
ISBN:9781305251809
Author:Jay L. Devore
Publisher:Cengage Learning

Statistics for The Behavioral Sciences (MindTap C...
Statistics
ISBN:9781305504912
Author:Frederick J Gravetter, Larry B. Wallnau
Publisher:Cengage Learning

Elementary Statistics: Picturing the World (7th E...
Statistics
ISBN:9780134683416
Author:Ron Larson, Betsy Farber
Publisher:PEARSON

The Basic Practice of Statistics
Statistics
ISBN:9781319042578
Author:David S. Moore, William I. Notz, Michael A. Fligner
Publisher:W. H. Freeman

Introduction to the Practice of Statistics
Statistics
ISBN:9781319013387
Author:David S. Moore, George P. McCabe, Bruce A. Craig
Publisher:W. H. Freeman