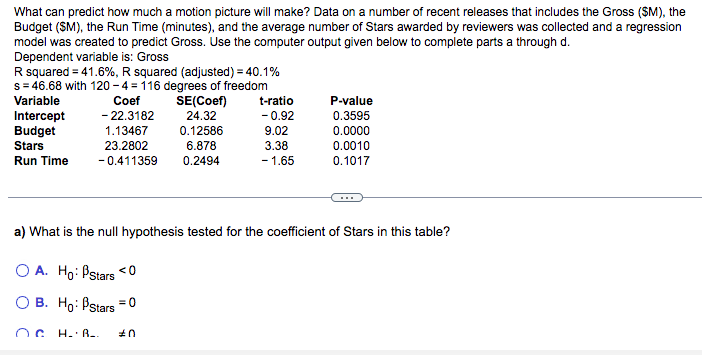
What can predict how much a motion picture will make? Data on a number of recent releases that includes the Gross ($M), the Budget (SM), the Run Time (minutes), and the average number of Stars awarded by reviewers was collected and a regression model was created to predict Gross. Use the computer output given below to complete parts a through d. Dependent variable is: Gross R squared = 41.6%, R squared (adjusted) = 40.1% s=46.68 with 120-4-116 degrees of freedom Variable Coef Intercept - 22.3182 Budget Stars Run Time 1.13467 23.2802 -0.411359 O A. Ho: PStars <0 OB. Ho: Pstars = 0 SE(Coef) 24.32 0.12586 6.878 0.2494 H..R.. #0 t-ratio -0.92 9.02 3.38 - 1.65 P-value 0.3595 0.0000 a) What is the null hypothesis tested for the coefficient of Stars in this table? 0.0010 0.1017
What can predict how much a motion picture will make? Data on a number of recent releases that includes the Gross ($M), the Budget (SM), the Run Time (minutes), and the average number of Stars awarded by reviewers was collected and a regression model was created to predict Gross. Use the computer output given below to complete parts a through d. Dependent variable is: Gross R squared = 41.6%, R squared (adjusted) = 40.1% s=46.68 with 120-4-116 degrees of freedom Variable Coef Intercept - 22.3182 Budget Stars Run Time 1.13467 23.2802 -0.411359 O A. Ho: PStars <0 OB. Ho: Pstars = 0 SE(Coef) 24.32 0.12586 6.878 0.2494 H..R.. #0 t-ratio -0.92 9.02 3.38 - 1.65 P-value 0.3595 0.0000 a) What is the null hypothesis tested for the coefficient of Stars in this table? 0.0010 0.1017

Glencoe Algebra 1, Student Edition, 9780079039897, 0079039898, 2018
18th Edition
ISBN:9780079039897
Author:Carter
Publisher:Carter
Chapter4: Equations Of Linear Functions
Section: Chapter Questions
Problem 4SGR

Related questions
Question
Also
part b - what is the t statistic?
and part c - what is the p value?
Transcribed Image Text:What can predict how much a motion picture will make? Data on a number of recent releases that includes the Gross ($M), the
Budget (SM), the Run Time (minutes), and the average number of Stars awarded by reviewers was collected and a regression
model was created to predict Gross. Use the computer output given below to complete parts a through d.
Dependent variable is: Gross
R squared = 41.6%, R squared (adjusted) = 40.1%
s=46.68 with 120-4-116 degrees of freedom
Variable
Coef
- 22.3182
Intercept
Budget
Stars
Run Time
a) What is
1.13467
23.2802
-0.411359
SE(Coef)
24.32
0.12586
6.878
0.2494
A. Ho: PStars <0
B. Ho: Stars = 0
OG HA.. #0
t-ratio
-0.92
9.02
3.38
- 1.65
P-value
0.3595
0.0000
0.0010
0.1017
null hypothesis tested for the coefficient of Stars in this table?
Expert Solution
This question has been solved!
Explore an expertly crafted, step-by-step solution for a thorough understanding of key concepts.

This is a popular solution!

Trending now
This is a popular solution!

Step by step
Solved in 5 steps with 3 images

Recommended textbooks for you
Glencoe Algebra 1, Student Edition, 9780079039897…
Algebra
ISBN:
9780079039897
Author:
Carter
Publisher:
McGraw Hill

Big Ideas Math A Bridge To Success Algebra 1: Stu…
Algebra
ISBN:
9781680331141
Author:
HOUGHTON MIFFLIN HARCOURT
Publisher:
Houghton Mifflin Harcourt

Glencoe Algebra 1, Student Edition, 9780079039897…
Algebra
ISBN:
9780079039897
Author:
Carter
Publisher:
McGraw Hill
Big Ideas Math A Bridge To Success Algebra 1: Stu…
Algebra
ISBN:
9781680331141
Author:
HOUGHTON MIFFLIN HARCOURT
Publisher:
Houghton Mifflin Harcourt

Functions and Change: A Modeling Approach to Coll…
Algebra
ISBN:
9781337111348
Author:
Bruce Crauder, Benny Evans, Alan Noell
Publisher:
Cengage Learning