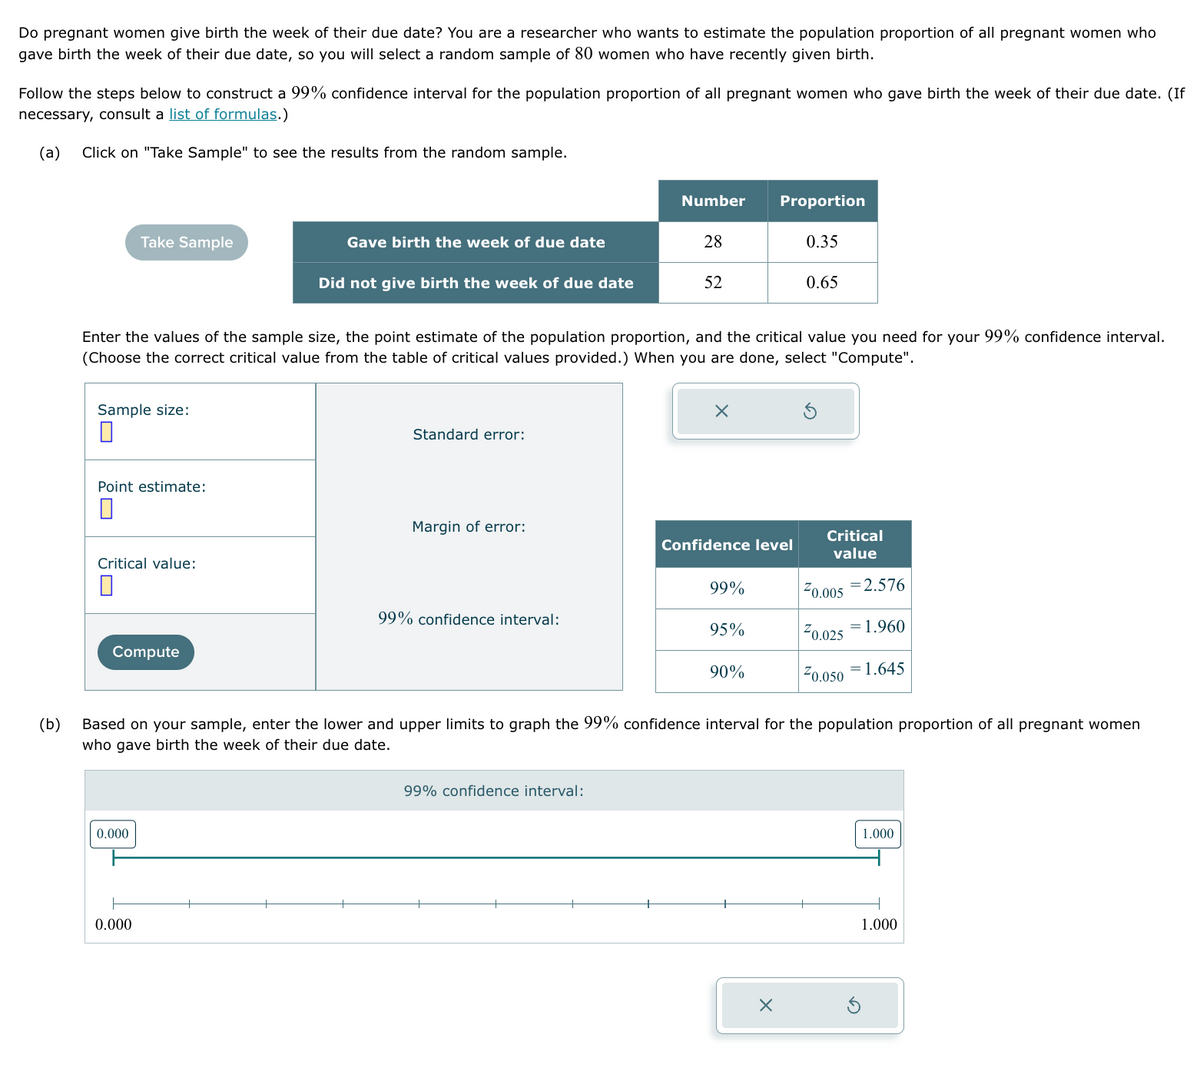
Do pregnant women give birth the week of their due date? You are a researcher who wants to estimate the population proportion of all pregnant women who gave birth the week of their due date, so you will select a random sample of 80 women who have recently given birth. Follow the steps below to construct a 99% confidence interval for the population proportion of all pregnant women who gave birth the week of their due date. (If necessary, consult a list of formulas.) (a) Click on "Take Sample" to see the results from the random sample. (b) Take Sample Sample size: 0 Point estimate: Critical value: Compute 0.000 Gave birth the week of due date Enter the values of the sample size, the point estimate of the population proportion, and the critical value you need for your 99% confidence interval. (Choose the correct critical value from the table of critical values provided.) When you are done, select "Compute". 0.000 Did not give birth the week of due date Standard error: Margin of error: 99% confidence interval: Number Proportion 28 52 99% confidence interval: Confidence level 99% 95% 0.35 90% 0.65 Based on your sample, enter the lower and upper limits to graph the 99% confidence interval for the population proportion of all pregnant women who gave birth the week of their due date. Critical value ²0.005 = 2.576 20.025=1.960 20.050 1.645 1.000 1.000
Do pregnant women give birth the week of their due date? You are a researcher who wants to estimate the population proportion of all pregnant women who gave birth the week of their due date, so you will select a random sample of 80 women who have recently given birth. Follow the steps below to construct a 99% confidence interval for the population proportion of all pregnant women who gave birth the week of their due date. (If necessary, consult a list of formulas.) (a) Click on "Take Sample" to see the results from the random sample. (b) Take Sample Sample size: 0 Point estimate: Critical value: Compute 0.000 Gave birth the week of due date Enter the values of the sample size, the point estimate of the population proportion, and the critical value you need for your 99% confidence interval. (Choose the correct critical value from the table of critical values provided.) When you are done, select "Compute". 0.000 Did not give birth the week of due date Standard error: Margin of error: 99% confidence interval: Number Proportion 28 52 99% confidence interval: Confidence level 99% 95% 0.35 90% 0.65 Based on your sample, enter the lower and upper limits to graph the 99% confidence interval for the population proportion of all pregnant women who gave birth the week of their due date. Critical value ²0.005 = 2.576 20.025=1.960 20.050 1.645 1.000 1.000

MATLAB: An Introduction with Applications
6th Edition
ISBN:9781119256830
Author:Amos Gilat
Publisher:Amos Gilat
Chapter1: Starting With Matlab
Section: Chapter Questions
Problem 1P

Related questions
Question
Transcribed Image Text:Do pregnant women give birth the week of their due date? You are a researcher who wants to estimate the population proportion of all pregnant women who
gave birth the week of their due date, so you will select a random sample of 80 women who have recently given birth.
Follow the steps below to construct a 99% confidence interval for the population proportion of all pregnant women who gave birth the week of their due date. (If
necessary, consult a list of formulas.)
(a) Click on "Take Sample" to see the results from the random sample.
(b)
Take Sample
Sample size:
0
Point estimate:
0
Critical value:
0
Compute
0.000
Gave birth the week of due date
Enter the values of the sample size, the point estimate of the population proportion, and the critical value you need for your 99% confidence interval.
(Choose the correct critical value from the table of critical values provided.) When you are done, select "Compute".
0.000
Did not give birth the week of due date
Standard error:
Margin of error:
99% confidence interval:
Number Proportion
0.35
28
99% confidence interval:
52
X
Confidence level
99%
95%
90%
0.65
X
Critical
value
²0.005
Based on your sample, enter the lower and upper limits to graph the 99% confidence interval for the population proportion of all pregnant women
who gave birth the week of their due date.
= 2.576
20.025=1.960
= 1.645
²0.050
1.000
1.000
Expert Solution
This question has been solved!
Explore an expertly crafted, step-by-step solution for a thorough understanding of key concepts.

This is a popular solution!

Trending now
This is a popular solution!

Step by step
Solved in 4 steps with 8 images

Recommended textbooks for you
MATLAB: An Introduction with Applications
Statistics
ISBN:
9781119256830
Author:
Amos Gilat
Publisher:
John Wiley & Sons Inc

Probability and Statistics for Engineering and th…
Statistics
ISBN:
9781305251809
Author:
Jay L. Devore
Publisher:
Cengage Learning

Statistics for The Behavioral Sciences (MindTap C…
Statistics
ISBN:
9781305504912
Author:
Frederick J Gravetter, Larry B. Wallnau
Publisher:
Cengage Learning
MATLAB: An Introduction with Applications
Statistics
ISBN:
9781119256830
Author:
Amos Gilat
Publisher:
John Wiley & Sons Inc
Probability and Statistics for Engineering and th…
Statistics
ISBN:
9781305251809
Author:
Jay L. Devore
Publisher:
Cengage Learning
Statistics for The Behavioral Sciences (MindTap C…
Statistics
ISBN:
9781305504912
Author:
Frederick J Gravetter, Larry B. Wallnau
Publisher:
Cengage Learning

Elementary Statistics: Picturing the World (7th E…
Statistics
ISBN:
9780134683416
Author:
Ron Larson, Betsy Farber
Publisher:
PEARSON

The Basic Practice of Statistics
Statistics
ISBN:
9781319042578
Author:
David S. Moore, William I. Notz, Michael A. Fligner
Publisher:
W. H. Freeman

Introduction to the Practice of Statistics
Statistics
ISBN:
9781319013387
Author:
David S. Moore, George P. McCabe, Bruce A. Craig
Publisher:
W. H. Freeman